$BARD Skyrockets +56%! Massive Breakout or Bull Trap? 🤔
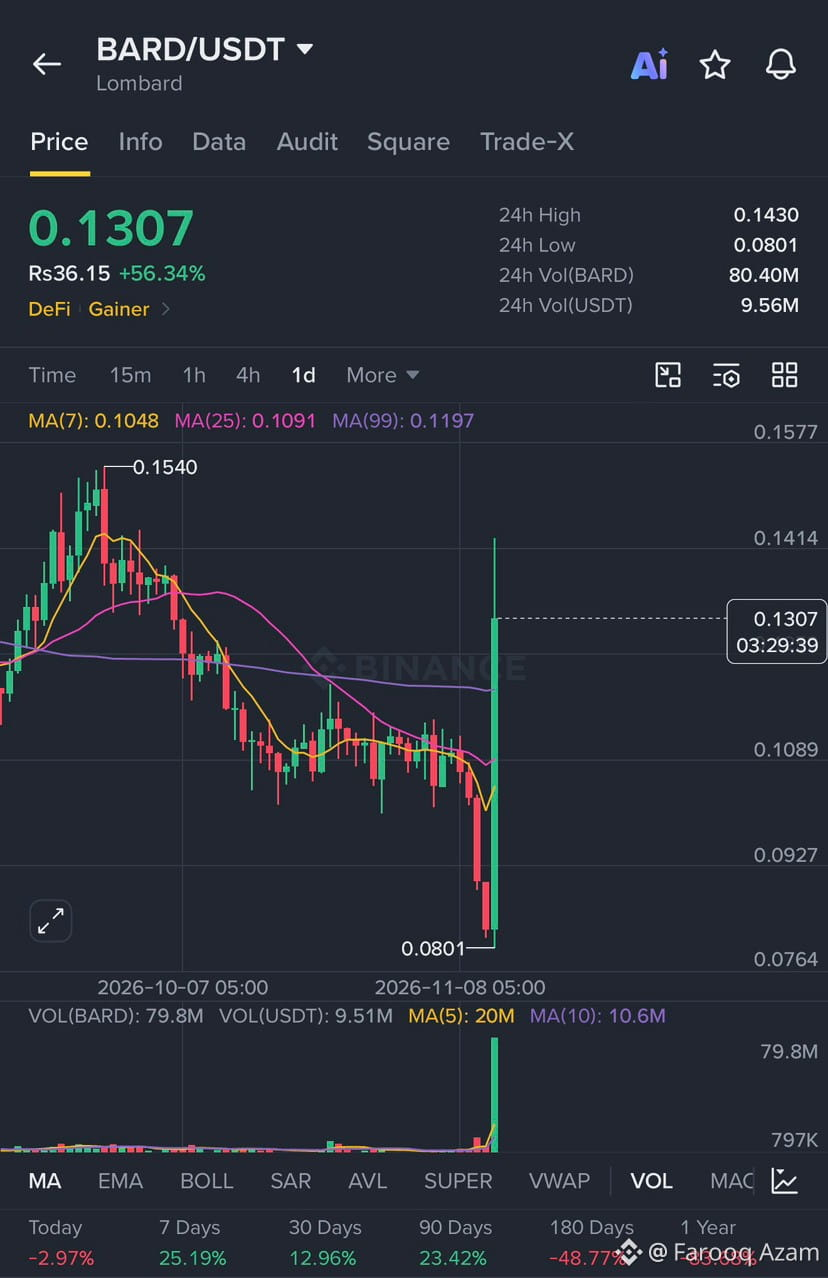
$BARD is currently one of the top gainers on Binance, printing a massive daily green candle. Let’s break down the chart! 👇
The Current Setup (1D Chart):
- Price: $0.1307
- 24h Surge: +56.34% 🔥
- The Move: After a prolonged downtrend, BARD found a hard bottom at $0.0801 and immediately rocketed to a high of $0.1430.
Technicals:
- Moving Averages Smashed: The price has aggressively broken above the MA(7), MA(25) and MA(99). The yellow MA(7) is crossing upwards a strong short-term bullish signal.
- Volume Explosion: Look at that volume bar! A massive influx of capital is driving this move, confirming the pump is not just thin order books.
- Support/Resistance: Immediate resistance is at the recent wick high of $0.1430. Immediate support sits around the MA99 ($0.1197) and MA25 ($0.1091).
⚠️ The Reality Check (Zoom Out):
Before you hit the buy button out of FOMO, look at the long-term metrics at the bottom of the chart:
- 90 Days: +23%
- 180 Days: -48%
- 1 Year: -83% 📉
This is a massive relief rally after a brutal year-long downtrend.
My Trading Strategy:
Buying directly into a +56% daily candle is highly risky. Historically, assets usually retrace to test the moving averages after such a violent pump.
- Watch for: A daily close above the MA99 ($0.1197) to confirm strength.
- Wait for: A pullback to the $0.10 - $0.11 zone for a safer entry.
- Always: Use a tight stop loss.
What’s your play on $BARD ? Are you buying the breakout or waiting for a retrace? Let me know in the comments! 👇
Disclaimer: Not financial advice. Always do your own research (DYOR). Crypto is highly volatile.
#Bard #BinanceSquare
$BARD is currently one of the top gainers on Binance, printing a massive daily green candle. Let’s break down the chart! 👇
The Current Setup (1D Chart):
- Price: $0.1307
- 24h Surge: +56.34% 🔥
- The Move: After a prolonged downtrend, BARD found a hard bottom at $0.0801 and immediately rocketed to a high of $0.1430.
Technicals:
- Moving Averages Smashed: The price has aggressively broken above the MA(7), MA(25) and MA(99). The yellow MA(7) is crossing upwards a strong short-term bullish signal.
- Volume Explosion: Look at that volume bar! A massive influx of capital is driving this move, confirming the pump is not just thin order books.
- Support/Resistance: Immediate resistance is at the recent wick high of $0.1430. Immediate support sits around the MA99 ($0.1197) and MA25 ($0.1091).
⚠️ The Reality Check (Zoom Out):
Before you hit the buy button out of FOMO, look at the long-term metrics at the bottom of the chart:
- 90 Days: +23%
- 180 Days: -48%
- 1 Year: -83% 📉
This is a massive relief rally after a brutal year-long downtrend.
My Trading Strategy:
Buying directly into a +56% daily candle is highly risky. Historically, assets usually retrace to test the moving averages after such a violent pump.
- Watch for: A daily close above the MA99 ($0.1197) to confirm strength.
- Wait for: A pullback to the $0.10 - $0.11 zone for a safer entry.
- Always: Use a tight stop loss.
What’s your play on $BARD ? Are you buying the breakout or waiting for a retrace? Let me know in the comments! 👇
Disclaimer: Not financial advice. Always do your own research (DYOR). Crypto is highly volatile.
#Bard #BinanceSquare