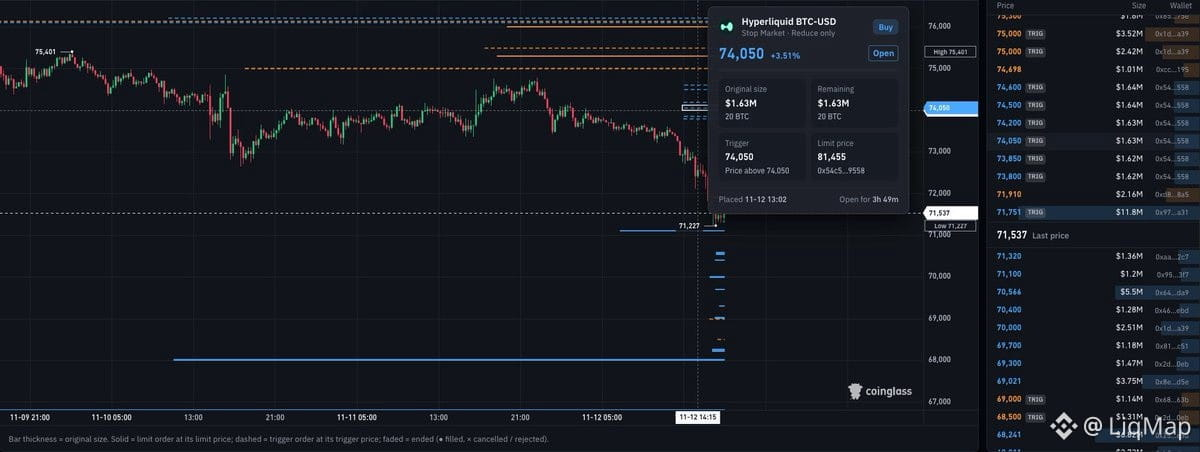
Hyperliquid whale tracking just got real. CoinGlass now shows large orders with their take-profit and stop-loss levels visible in one dashboard. You can literally see where the size is positioned and where they're planning exits.
This is huge for reading order flow. When you spot clusters of whale stops or profit targets, you're looking at liquidity zones the market will either defend or hunt. Price tends to gravitate toward these levels — either to trigger stops and fuel a move, or to hit take-profits and reverse.
If you're trading $HYPE or any Hyperliquid pair, this gives you an edge on positioning. Stack this with open interest shifts and funding rate swings, and you've got a clear map of where the squeeze potential sits. Watch for stop clusters below support — that's your liquidation fuel. Watch for TP clusters above resistance — that's your exit liquidity.
Derivatives data like this is how you trade the players, not just the price. The whales telegraph their hand; now you can front-run the move.
This is huge for reading order flow. When you spot clusters of whale stops or profit targets, you're looking at liquidity zones the market will either defend or hunt. Price tends to gravitate toward these levels — either to trigger stops and fuel a move, or to hit take-profits and reverse.
If you're trading $HYPE or any Hyperliquid pair, this gives you an edge on positioning. Stack this with open interest shifts and funding rate swings, and you've got a clear map of where the squeeze potential sits. Watch for stop clusters below support — that's your liquidation fuel. Watch for TP clusters above resistance — that's your exit liquidity.
Derivatives data like this is how you trade the players, not just the price. The whales telegraph their hand; now you can front-run the move.