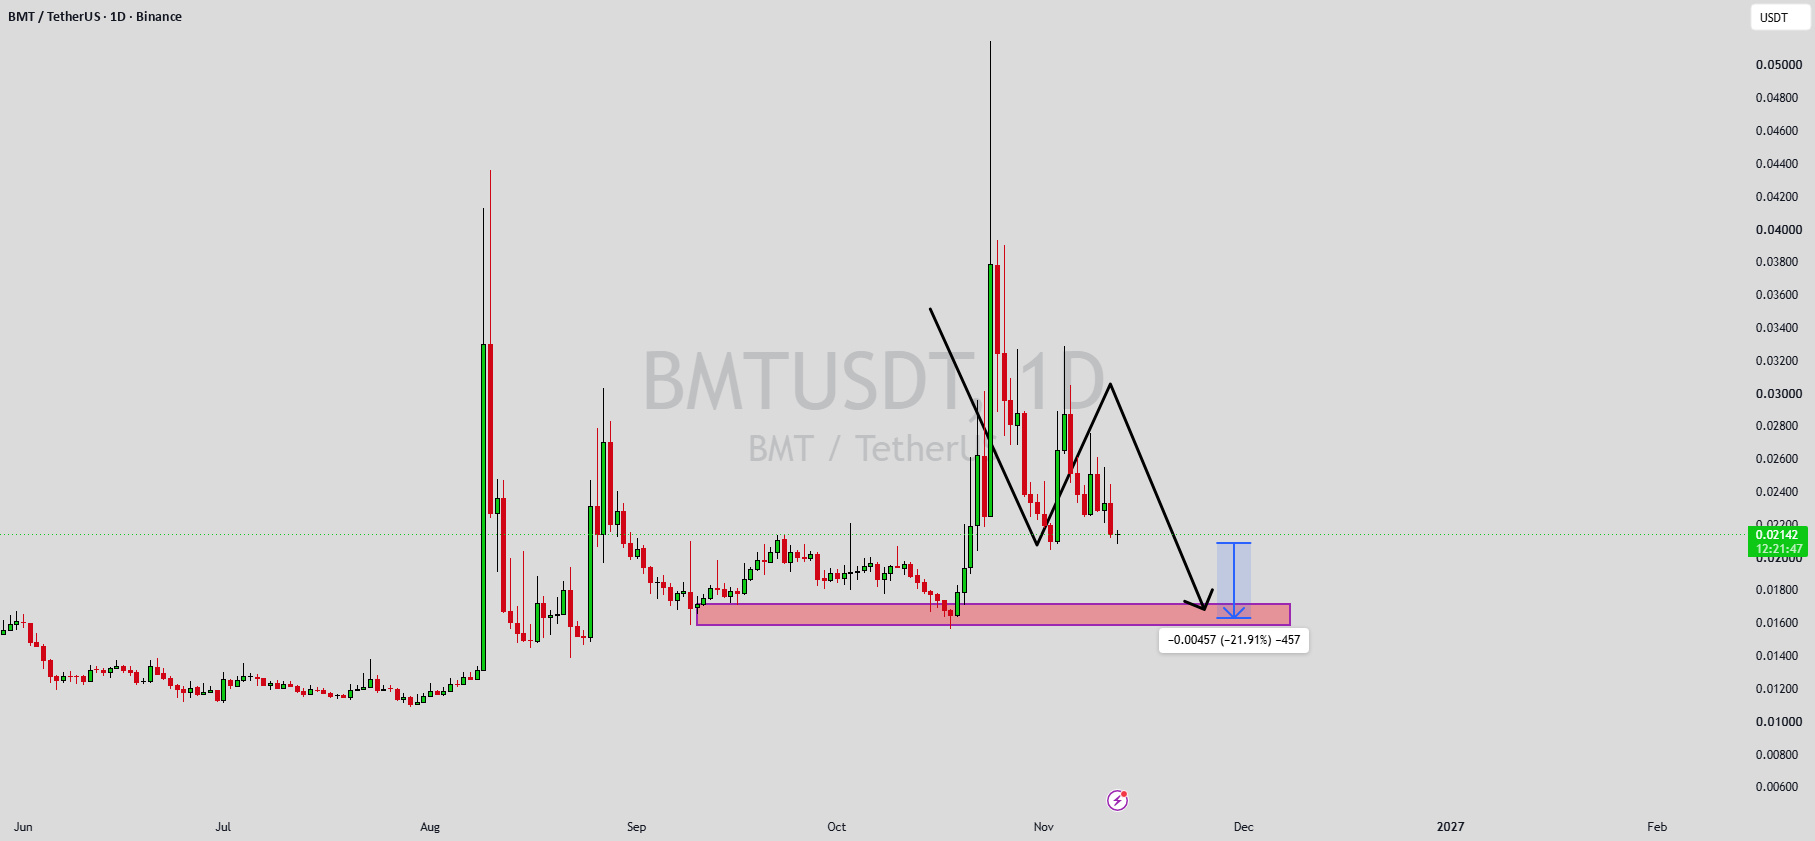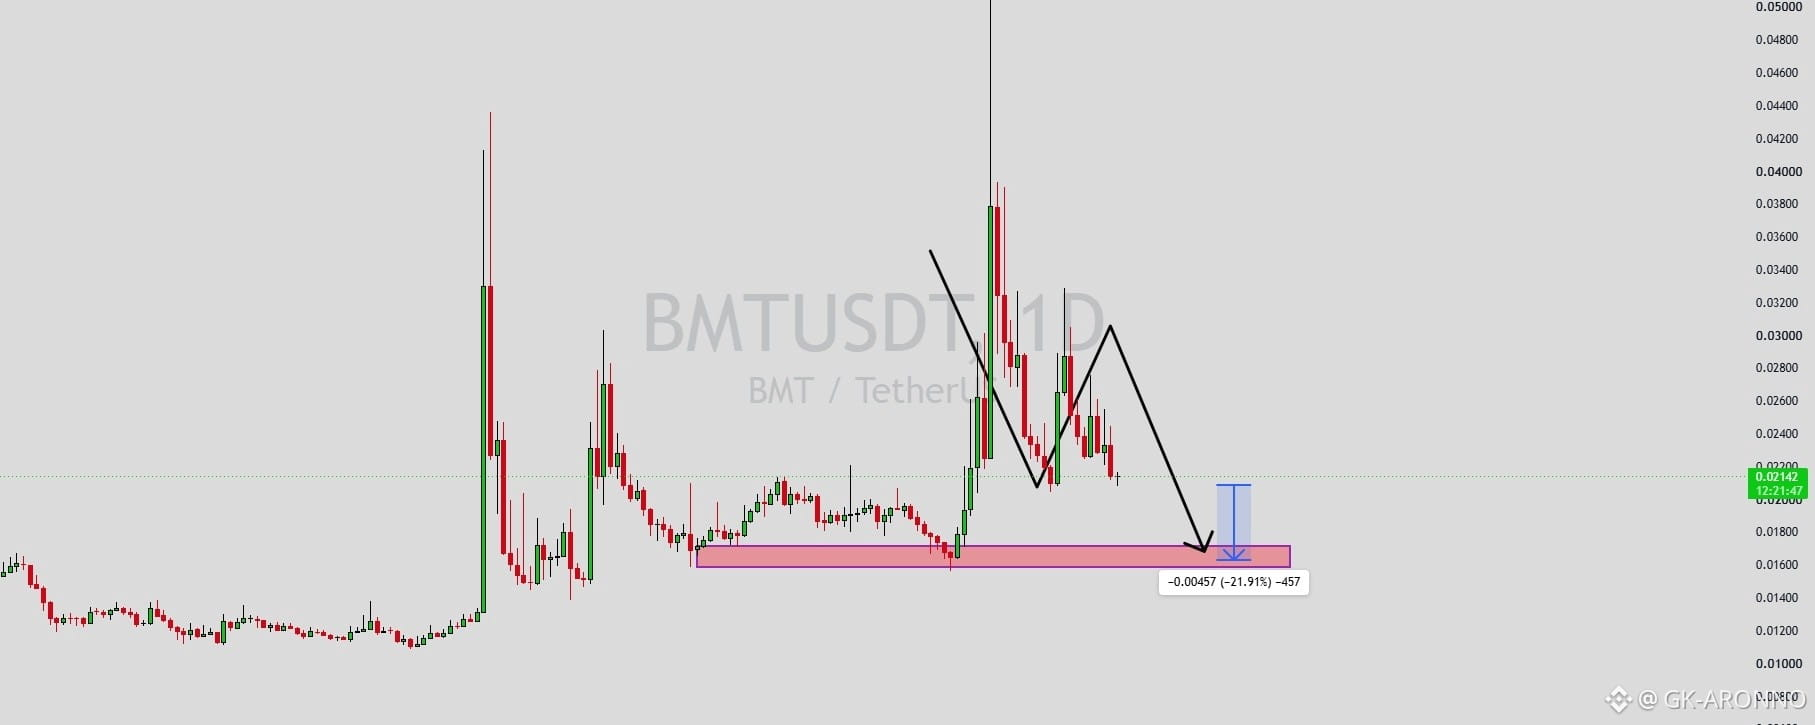


BMTUSDT is printing a classic lower high reversal pattern on the daily chart following an aggressive pump and immediate rejection. The massive upper wick from earlier this month revealed heavy profit taking, and the subsequent recovery attempt has clearly stalled out, confirming that buyers lack the strength to challenge the local highs.
With the secondary peak now confirmed around the 0.030 USDT area, price action is curling back downward under steady selling pressure. Momentum continues to favor the bears as candles consistently print lower closes, indicating that the market is ready to complete a deeper corrective leg.
The logical target for this slide sits right at the primary horizontal demand shelf between 0.016 and 0.017 USDT, translating to a potential decline of roughly 22 percent from current levels. On the other hand, a decisive push back above the recent 0.030 USDT swing high would neutralize this short-term bearish outlook.
Where do you see BMTUSDT heading from here? Share your perspective in the comment section below, and remember to like and share if this analysis gives you a clearer view of the market.