$RWUSD: RWUSD: Rethinking the Volume‑Only Narrative
$RWUSD: RWUSD shows a flat hourly direction while volume sits above baseline, a combination that often fuels the one‑way volume myth. Does higher volume automatically imply bullish accumulation, or are we missing a nuance? I once imagined my research notebook as a coffee‑driven hamster wheel: I spin charts faster when the volume spikes, hoping the hamster will reveal a secret trend. The joke is that the wheel never stops, yet the market rarely gives a single‑direction answer.
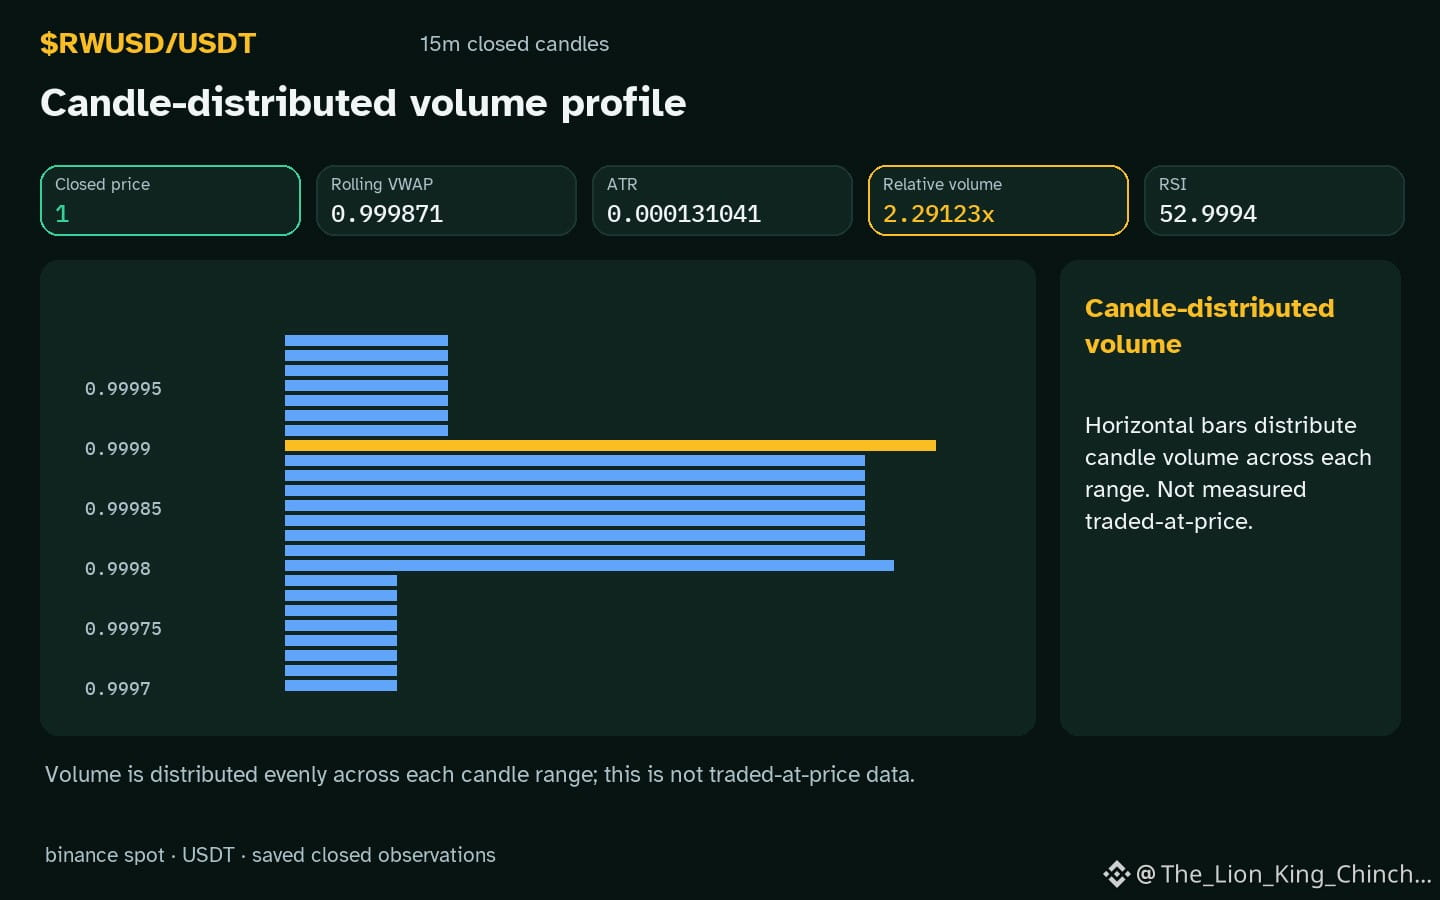
A simple mechanism can explain the disconnect. Volume measures activity, not intent. When price is range‑bound, a surge in trades may simply reflect tighter bid‑ask battles rather than a directional push. In this scenario, the relative volume 2.29x baseline is a useful flag, but it should be paired with price action. If the next closed candle shows a breakout beyond the local support 0.9998 or resistance 1, the volume spike gains relevance; if price remains inside the range, the spike likely represents noise.
To reassess the interpretation, watch for a closed hourly candle that moves beyond the recorded range while still carrying elevated volume. Such evidence would either support or weaken the myth, reminding us that volume alone is an incomplete story.
Probabilistic market research, not a recommendation or guaranteed return.
A useful cross-check: $ETH has hourly direction up and volume not above its baseline; $ERA has hourly direction up and volume not above its baseline. This alone does not establish correlation.
#RWUSD #ETH #ERA
$RWUSD: RWUSD shows a flat hourly direction while volume sits above baseline, a combination that often fuels the one‑way volume myth. Does higher volume automatically imply bullish accumulation, or are we missing a nuance? I once imagined my research notebook as a coffee‑driven hamster wheel: I spin charts faster when the volume spikes, hoping the hamster will reveal a secret trend. The joke is that the wheel never stops, yet the market rarely gives a single‑direction answer.
A simple mechanism can explain the disconnect. Volume measures activity, not intent. When price is range‑bound, a surge in trades may simply reflect tighter bid‑ask battles rather than a directional push. In this scenario, the relative volume 2.29x baseline is a useful flag, but it should be paired with price action. If the next closed candle shows a breakout beyond the local support 0.9998 or resistance 1, the volume spike gains relevance; if price remains inside the range, the spike likely represents noise.
To reassess the interpretation, watch for a closed hourly candle that moves beyond the recorded range while still carrying elevated volume. Such evidence would either support or weaken the myth, reminding us that volume alone is an incomplete story.
Probabilistic market research, not a recommendation or guaranteed return.
A useful cross-check: $ETH has hourly direction up and volume not above its baseline; $ERA has hourly direction up and volume not above its baseline. This alone does not establish correlation.
#RWUSD #ETH #ERA