$ETH: Why a Coin Can Fall While Buyers Outnumber Sellers in Count
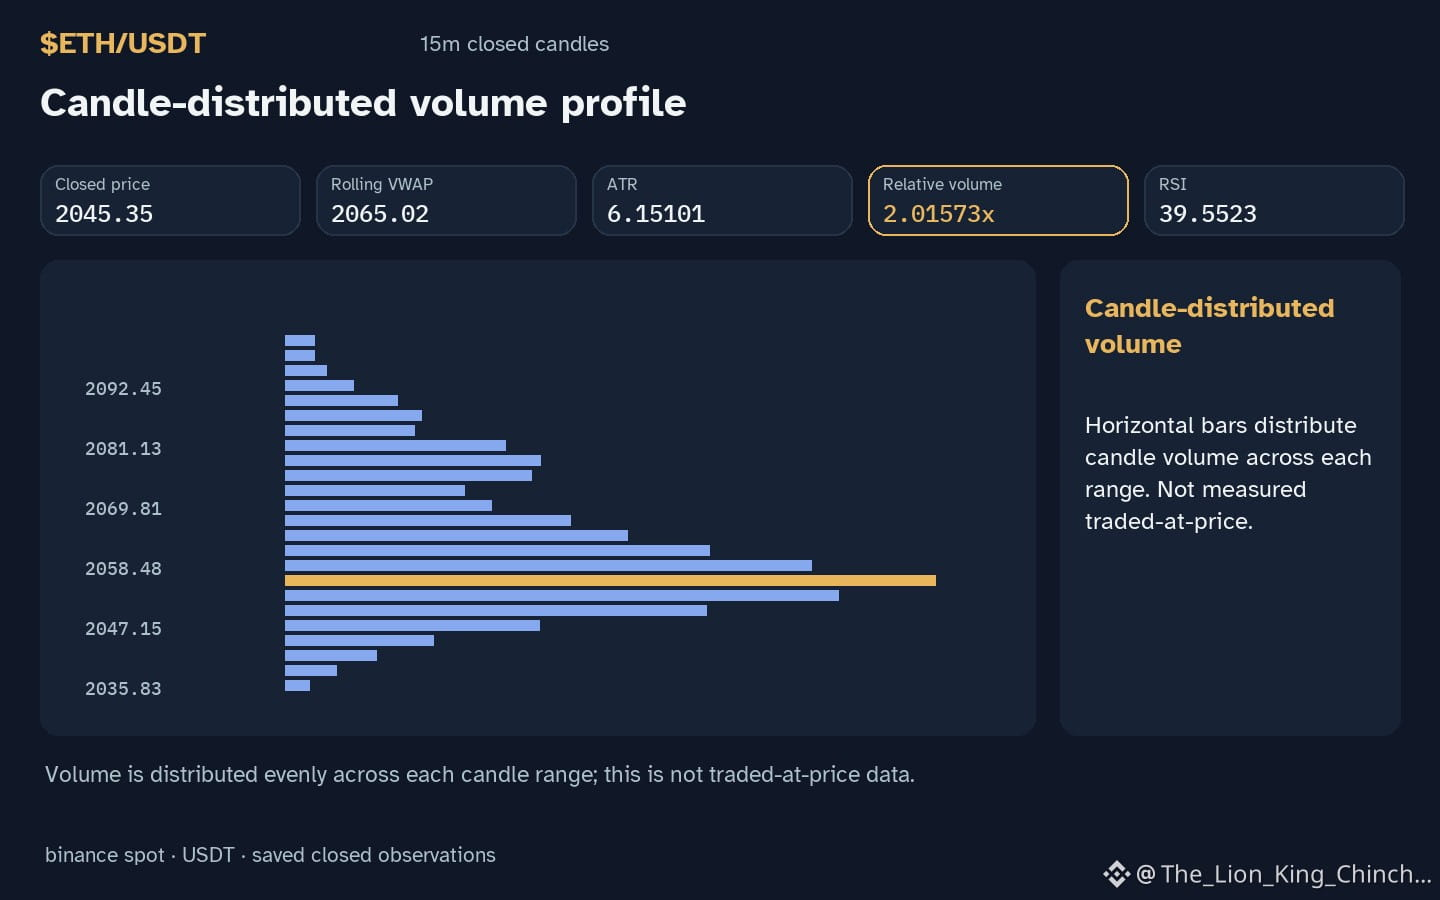
Why does $ETH move lower even when the count of participants appears to favor buying? The hourly direction is down while relative volume sits at 2.02x baseline, suggesting many trades but a price decline.
**Myth**
Some traders assume that a higher number of buyers must push the price up. The misconception is that participant count alone determines direction.
**Explanation**
If order sizes are asymmetric, a few large sell orders can outweigh many small buy orders. The aggregate volume metric captures total traded amount, not the distribution of order size. When 2.02x baseline volume is observed alongside a down move, it may indicate that larger participants are on the sell side, while numerous smaller buyers generate the count illusion. This mechanism does not rely on any specific motive; it simply reflects how unequal trade sizes can dominate market pressure.
**Counterexample**
If the next hourly candle shows a neutral or upward price change while volume remains high, the asymmetry hypothesis weakens. A balanced size distribution would then be more plausible.
**Self‑check**
To reassess, watch for a shift in the volume‑price relationship: if high baseline‑ratio volume coincides with a sustained rise, the earlier interpretation should be revised. Conversely, continued declines with the same volume ratio support the asymmetry view.
Understanding the difference between count and size helps avoid over‑reliance on participant numbers when evaluating price action.
Probabilistic market research, not a recommendation or guaranteed return.
#ETH #CryptoLearning
Why does $ETH move lower even when the count of participants appears to favor buying? The hourly direction is down while relative volume sits at 2.02x baseline, suggesting many trades but a price decline.
**Myth**
Some traders assume that a higher number of buyers must push the price up. The misconception is that participant count alone determines direction.
**Explanation**
If order sizes are asymmetric, a few large sell orders can outweigh many small buy orders. The aggregate volume metric captures total traded amount, not the distribution of order size. When 2.02x baseline volume is observed alongside a down move, it may indicate that larger participants are on the sell side, while numerous smaller buyers generate the count illusion. This mechanism does not rely on any specific motive; it simply reflects how unequal trade sizes can dominate market pressure.
**Counterexample**
If the next hourly candle shows a neutral or upward price change while volume remains high, the asymmetry hypothesis weakens. A balanced size distribution would then be more plausible.
**Self‑check**
To reassess, watch for a shift in the volume‑price relationship: if high baseline‑ratio volume coincides with a sustained rise, the earlier interpretation should be revised. Conversely, continued declines with the same volume ratio support the asymmetry view.
Understanding the difference between count and size helps avoid over‑reliance on participant numbers when evaluating price action.
Probabilistic market research, not a recommendation or guaranteed return.
#ETH #CryptoLearning