🔴 $OGN /USDT – BEARS MAINTAIN CONTROL! Will $0.02150 Support Break Next?
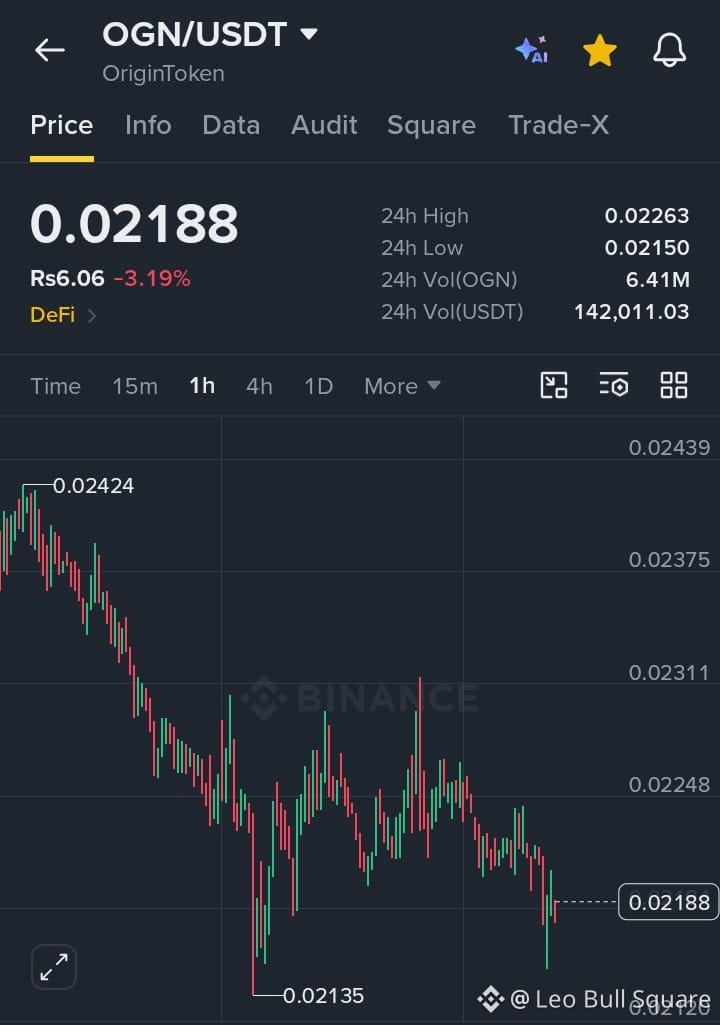
$OGN /USDT is showing clear bearish momentum on the 1H chart, currently trading at $0.02188, down 3.19% over the last 24 hours. After rejecting the $0.02424 high, price has formed a series of lower highs and lower lows, confirming continued selling pressure. The immediate support zone sits around $0.02150–$0.02135; a decisive breakdown below this area could trigger another bearish leg, while resistance at $0.02248–$0.02263 remains the key zone bulls must reclaim to shift momentum. From an SMC perspective, traders should watch for a liquidity sweep below support followed by a weak recovery or a pullback rejection before considering a short entry. Don't chase the move—wait for confirmation and manage risk carefully.
#OGN/USDT
$OGN /USDT is showing clear bearish momentum on the 1H chart, currently trading at $0.02188, down 3.19% over the last 24 hours. After rejecting the $0.02424 high, price has formed a series of lower highs and lower lows, confirming continued selling pressure. The immediate support zone sits around $0.02150–$0.02135; a decisive breakdown below this area could trigger another bearish leg, while resistance at $0.02248–$0.02263 remains the key zone bulls must reclaim to shift momentum. From an SMC perspective, traders should watch for a liquidity sweep below support followed by a weak recovery or a pullback rejection before considering a short entry. Don't chase the move—wait for confirmation and manage risk carefully.
#OGN/USDT