$ZEC Under Pressure — Is $950 the Bottom?
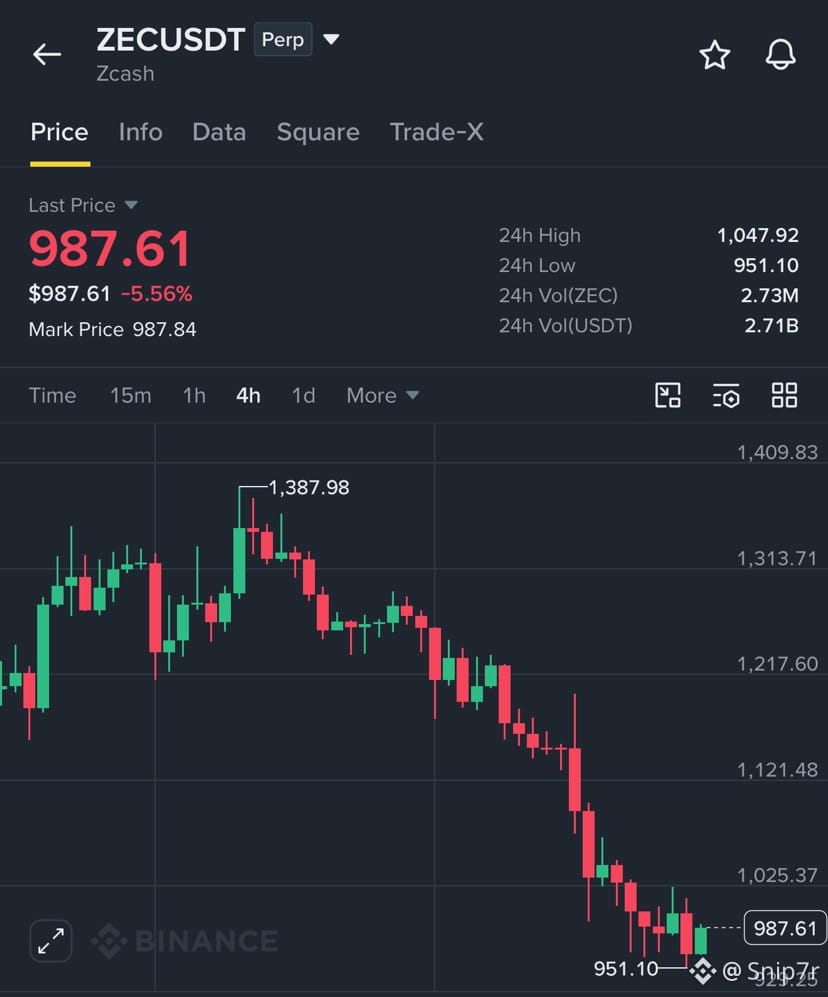
ZEC has dropped to $987, nearly 29% below its recent high of $1,388. The 4H chart remains bearish, with lower highs, lower lows, and strong selling volume.
ZEC recently bounced from $951, but it’s too early to call this a reversal.
Key levels to watch:
* Support: $950. A breakdown could push ZEC toward $930–$900.
* Resistance: $1,025–$1,050. A breakout with strong volume could signal recovery.
My view: Avoid chasing SHORT positions near support or rushing into LONG positions without confirmation. BTC’s direction will also influence ZEC’s next move.
The next move around $950 could be crucial. Are buyers ready to defend it?
#BinancePick
Not financial advice. DYOR.
ZEC has dropped to $987, nearly 29% below its recent high of $1,388. The 4H chart remains bearish, with lower highs, lower lows, and strong selling volume.
ZEC recently bounced from $951, but it’s too early to call this a reversal.
Key levels to watch:
* Support: $950. A breakdown could push ZEC toward $930–$900.
* Resistance: $1,025–$1,050. A breakout with strong volume could signal recovery.
My view: Avoid chasing SHORT positions near support or rushing into LONG positions without confirmation. BTC’s direction will also influence ZEC’s next move.
The next move around $950 could be crucial. Are buyers ready to defend it?
#BinancePick
Not financial advice. DYOR.