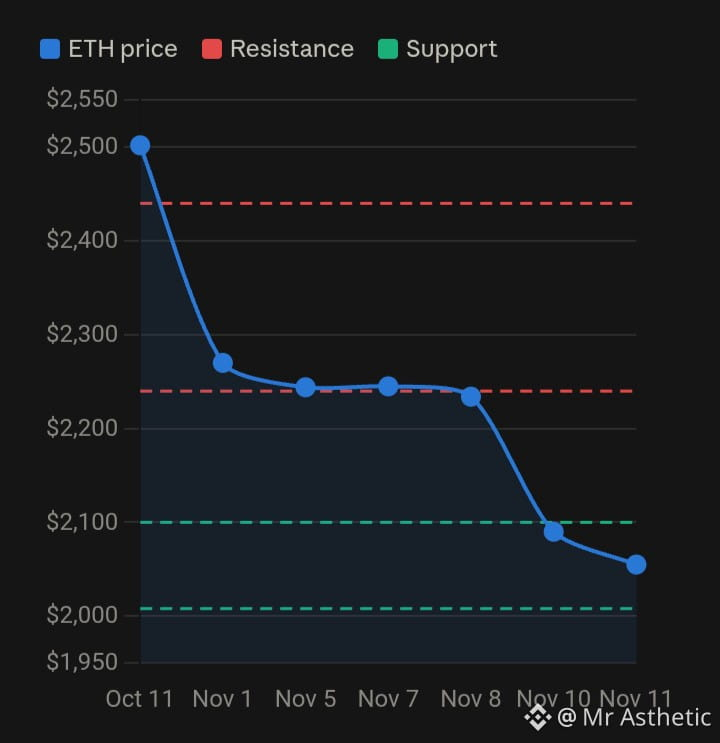
$ETH is at about $2,055 (7:30 a.m. ET today), down roughly 18% from a month ago. It was $2,090 yesterday and $2,502 a month ago. The chart above is built from the daily price points I could find, not full candlesticks, so it shows the trend and key levels rather than intraday detail. (Fortune)
What changed: ETH lost the ~$2,240 support that was holding on Nov 5, then broke below $2,100. The recent rejection area at $2,440–$2,450 is overhead, and a liquidation cluster sits near $2,635. (crypto)
Levels to watch
Resistance: $2,240, then $2,300, then $2,440–$2,450.
Support: the weekly Supertrend, near $2,008, is the line that matters now. If $2,000 breaks, the $1,800 area comes into view. (crypto) (coincentral)
Momentum and flows
The daily Awesome Oscillator was still negative as of Nov 5, and the weekly MACD histogram was shrinking. (crypto)
ETF flows have been choppy: $53M in on Nov 4, after $139.7M and $85.3M of withdrawals on Nov 2 and 3. (crypto)
Another $93.3M left US spot ETH ETFs on Nov 6. (coincentral)
Bias: bearish short term. Bulls need a reclaim of $2,240 to repair the structure. A daily close below ~$2,000 would open $1,800–$1,900. Some analysts still target $2,800–$3,000, but that needs a much stronger base first.
This isn't financial advice, and crypto moves fast. Check a live chart before acting.
#AnthropicRejectsIPODelayValuationinQuestion #HotCPIDecemberHikePriced #CanNvidiaEarningsEaseMarketConcerns? #
What changed: ETH lost the ~$2,240 support that was holding on Nov 5, then broke below $2,100. The recent rejection area at $2,440–$2,450 is overhead, and a liquidation cluster sits near $2,635. (crypto)
Levels to watch
Resistance: $2,240, then $2,300, then $2,440–$2,450.
Support: the weekly Supertrend, near $2,008, is the line that matters now. If $2,000 breaks, the $1,800 area comes into view. (crypto) (coincentral)
Momentum and flows
The daily Awesome Oscillator was still negative as of Nov 5, and the weekly MACD histogram was shrinking. (crypto)
ETF flows have been choppy: $53M in on Nov 4, after $139.7M and $85.3M of withdrawals on Nov 2 and 3. (crypto)
Another $93.3M left US spot ETH ETFs on Nov 6. (coincentral)
Bias: bearish short term. Bulls need a reclaim of $2,240 to repair the structure. A daily close below ~$2,000 would open $1,800–$1,900. Some analysts still target $2,800–$3,000, but that needs a much stronger base first.
This isn't financial advice, and crypto moves fast. Check a live chart before acting.
#AnthropicRejectsIPODelayValuationinQuestion #HotCPIDecemberHikePriced #CanNvidiaEarningsEaseMarketConcerns? #