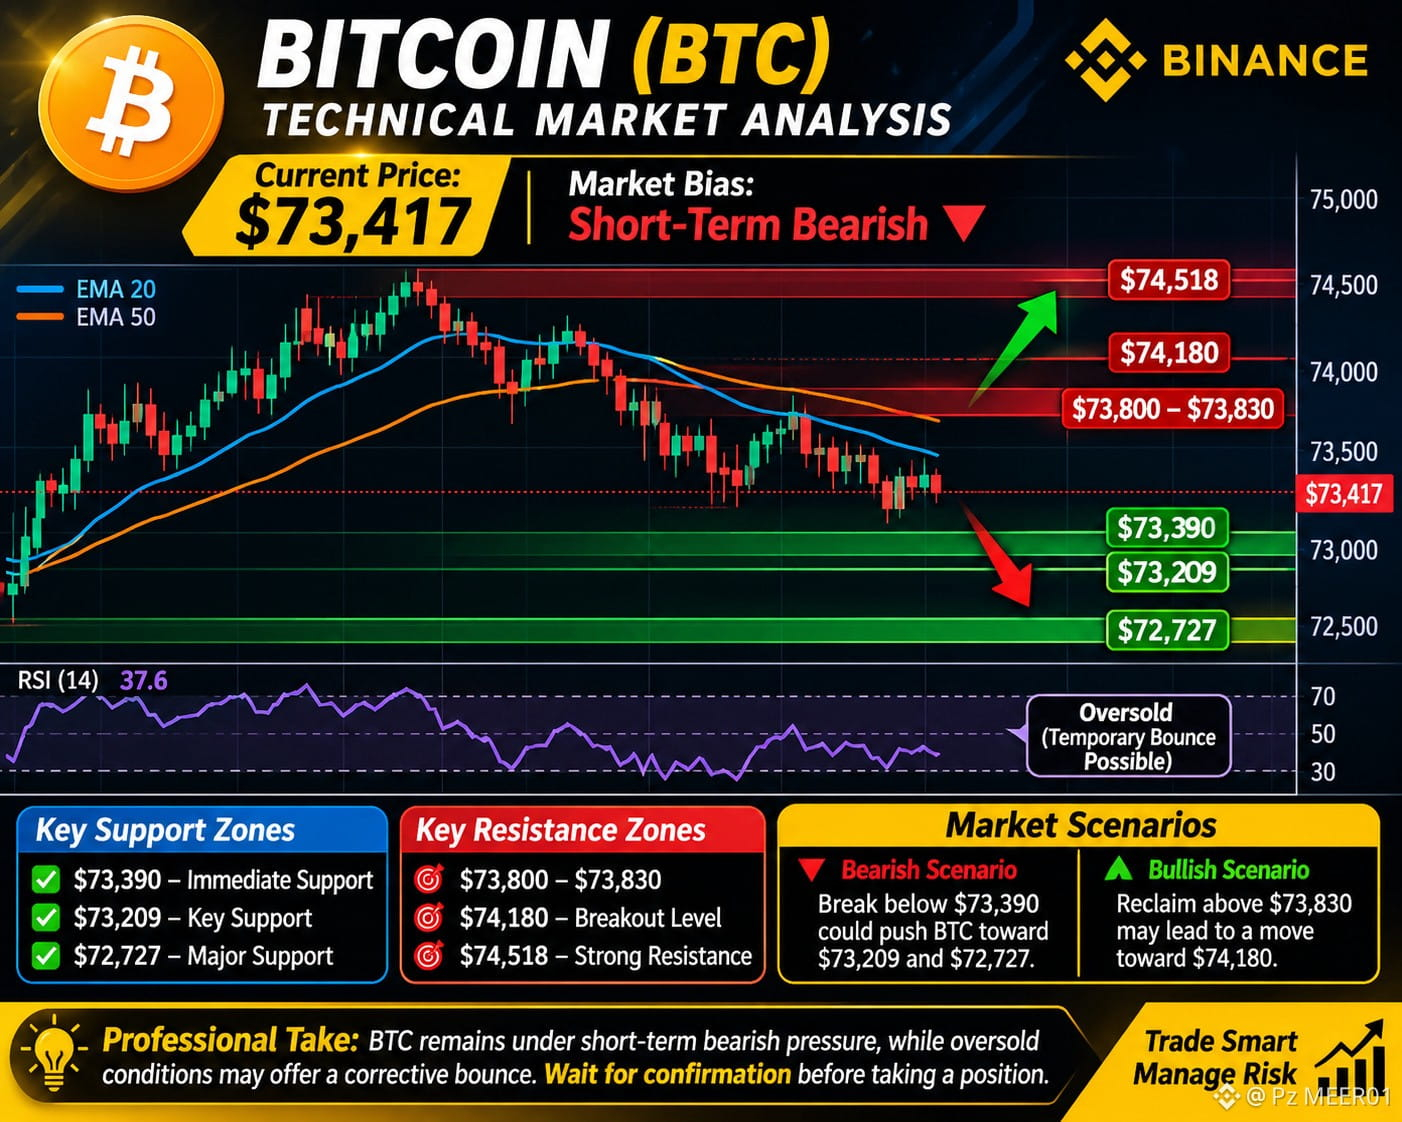
$BTC Price Analysis: Sellers Remain in Control — Key Support & Resistance Levels to Watch
Reference Price: $73,417
Market Bias: Short-Term Bearish
Analysis: Multi-Timeframe Technical Structure
1. Market Structure
Bitcoin is showing short-term selling pressure following its rejection from the $74,800 resistance region. The price remains below key 1H and 4H EMA levels, indicating that bullish momentum has not yet been restored.
The 15-minute RSI is deeply oversold, suggesting that a temporary relief bounce is possible. However, an oversold RSI alone is not a confirmed reversal signal.
2. Key Technical Levels
Support Zones
- $73,390 — Immediate support
- $73,209 — Secondary support
- $72,727 — Major intraday support
Resistance Zones
- $73,800–$73,830 — Immediate resistance
- $74,180 — Short-term breakout level
- $74,518 — Higher-timeframe resistance
3. Possible Market Scenarios
Bearish Continuation:
A confirmed breakdown below $73,390 could expose $73,209, followed by $72,727.
Bullish Recovery:
A sustained reclaim above $73,830, followed by a breakout above $74,180, would indicate improving buying momentum.
4. Professional Market View
The current structure favors sellers in the short term, while oversold conditions leave room for a corrective bounce. A stronger bullish outlook requires confirmation through price action, volume and resistance reclamation.
Trading Strategy: Avoid emotional entries and wait for confirmation around key levels. Prioritize capital protection and maintain disciplined risk management.
#Bitcoin #BTC #TechnicalAnalysis #CryptoMarket #BinanceSquare
Reference Price: $73,417
Market Bias: Short-Term Bearish
Analysis: Multi-Timeframe Technical Structure
1. Market Structure
Bitcoin is showing short-term selling pressure following its rejection from the $74,800 resistance region. The price remains below key 1H and 4H EMA levels, indicating that bullish momentum has not yet been restored.
The 15-minute RSI is deeply oversold, suggesting that a temporary relief bounce is possible. However, an oversold RSI alone is not a confirmed reversal signal.
2. Key Technical Levels
Support Zones
- $73,390 — Immediate support
- $73,209 — Secondary support
- $72,727 — Major intraday support
Resistance Zones
- $73,800–$73,830 — Immediate resistance
- $74,180 — Short-term breakout level
- $74,518 — Higher-timeframe resistance
3. Possible Market Scenarios
Bearish Continuation:
A confirmed breakdown below $73,390 could expose $73,209, followed by $72,727.
Bullish Recovery:
A sustained reclaim above $73,830, followed by a breakout above $74,180, would indicate improving buying momentum.
4. Professional Market View
The current structure favors sellers in the short term, while oversold conditions leave room for a corrective bounce. A stronger bullish outlook requires confirmation through price action, volume and resistance reclamation.
Trading Strategy: Avoid emotional entries and wait for confirmation around key levels. Prioritize capital protection and maintain disciplined risk management.
#Bitcoin #BTC #TechnicalAnalysis #CryptoMarket #BinanceSquare