Understanding Session Liquidity for $FIL
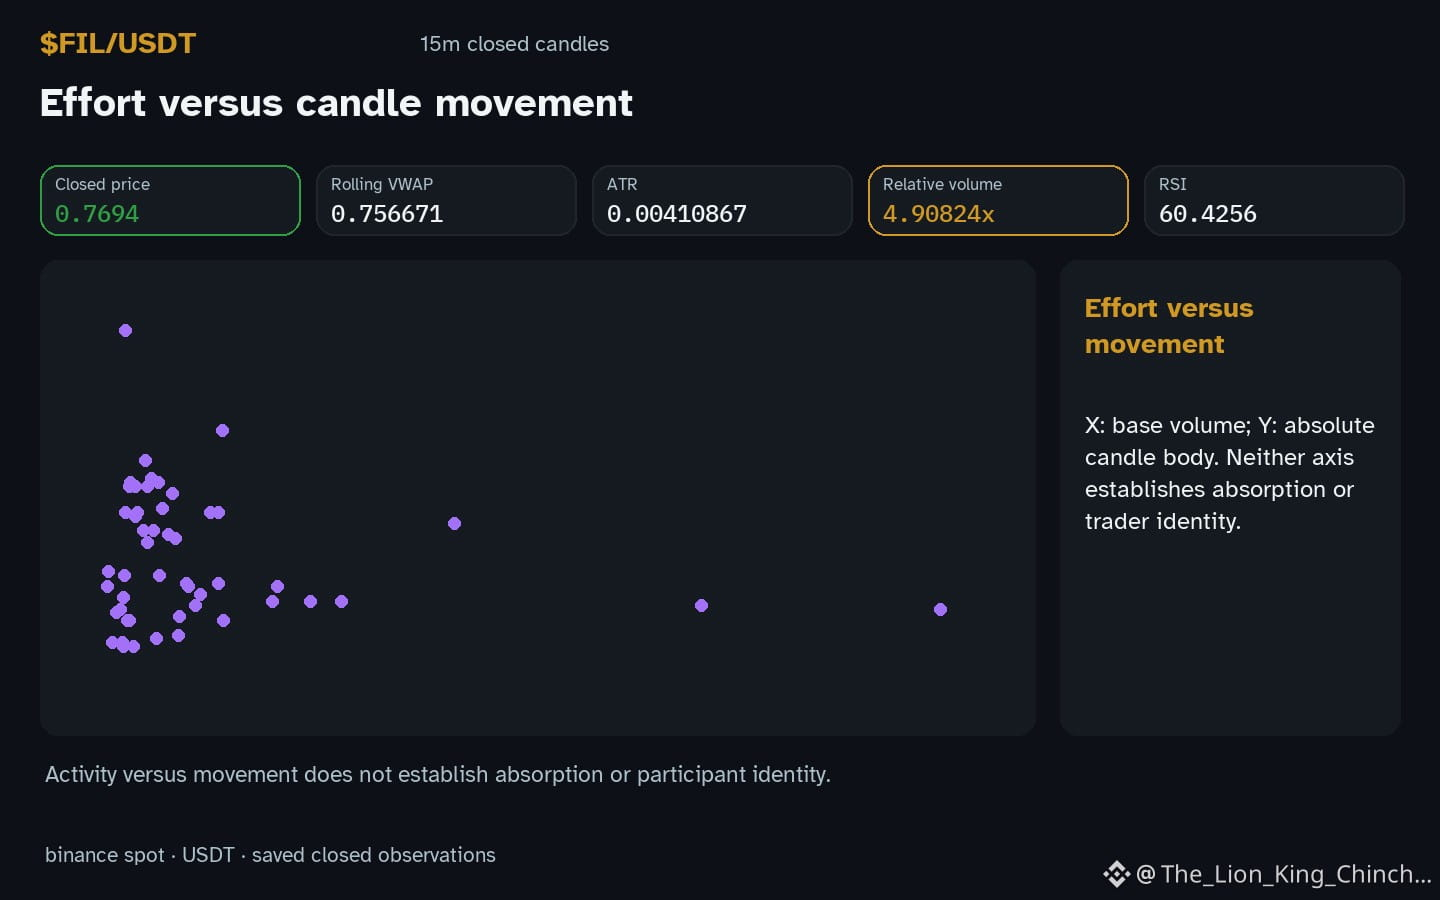
Why does a higher relative volume sometimes feel bullish for $FIL and other times not? A common assumption is that volume above its baseline automatically confirms a strong move. The counterexample to consider is that $FIL can show hourly direction up with volume above baseline, yet the price may still hover inside a recorded range. In this scenario the session liquidity context matters more than the raw volume number.
When volume spikes, it can simply reflect a larger pool of market participants trading without adding directional pressure. If the price remains within support and resistance levels, the extra trades may be absorbed without shifting the baseline. The mechanism is that volume measures activity, not intent; baseline levels provide a reference but do not guarantee momentum.
What could change the reading? A clear break of the local support or resistance would give the volume a directional anchor. Until such a breakout occurs, the observation should be treated as a neutral signal. Traders should reassess by checking whether price has moved beyond the prior range and whether the volume remains consistently above the baseline across multiple sessions. This approach keeps the analysis grounded in observable session liquidity without implying certainty.
Risk note: Any interpretation is hypothetical and should be weighed against broader market context.
Probabilistic market research, not a recommendation or guaranteed return.
The comparison to keep in mind: $ETH has hourly direction down and volume not above its baseline; $SOXLB has hourly direction up and volume not above its baseline. This alone does not establish correlation.
The headline or the underlying mechanism?
#FIL #ETH #SOXLB #CryptoLearning
Why does a higher relative volume sometimes feel bullish for $FIL and other times not? A common assumption is that volume above its baseline automatically confirms a strong move. The counterexample to consider is that $FIL can show hourly direction up with volume above baseline, yet the price may still hover inside a recorded range. In this scenario the session liquidity context matters more than the raw volume number.
When volume spikes, it can simply reflect a larger pool of market participants trading without adding directional pressure. If the price remains within support and resistance levels, the extra trades may be absorbed without shifting the baseline. The mechanism is that volume measures activity, not intent; baseline levels provide a reference but do not guarantee momentum.
What could change the reading? A clear break of the local support or resistance would give the volume a directional anchor. Until such a breakout occurs, the observation should be treated as a neutral signal. Traders should reassess by checking whether price has moved beyond the prior range and whether the volume remains consistently above the baseline across multiple sessions. This approach keeps the analysis grounded in observable session liquidity without implying certainty.
Risk note: Any interpretation is hypothetical and should be weighed against broader market context.
Probabilistic market research, not a recommendation or guaranteed return.
The comparison to keep in mind: $ETH has hourly direction down and volume not above its baseline; $SOXLB has hourly direction up and volume not above its baseline. This alone does not establish correlation.
The headline or the underlying mechanism?
#FIL #ETH #SOXLB #CryptoLearning