$ARIA
🚀 $ARIA/USDT Technical Analysis: Parabolic Expansion & Key Levels to Watch 🚀
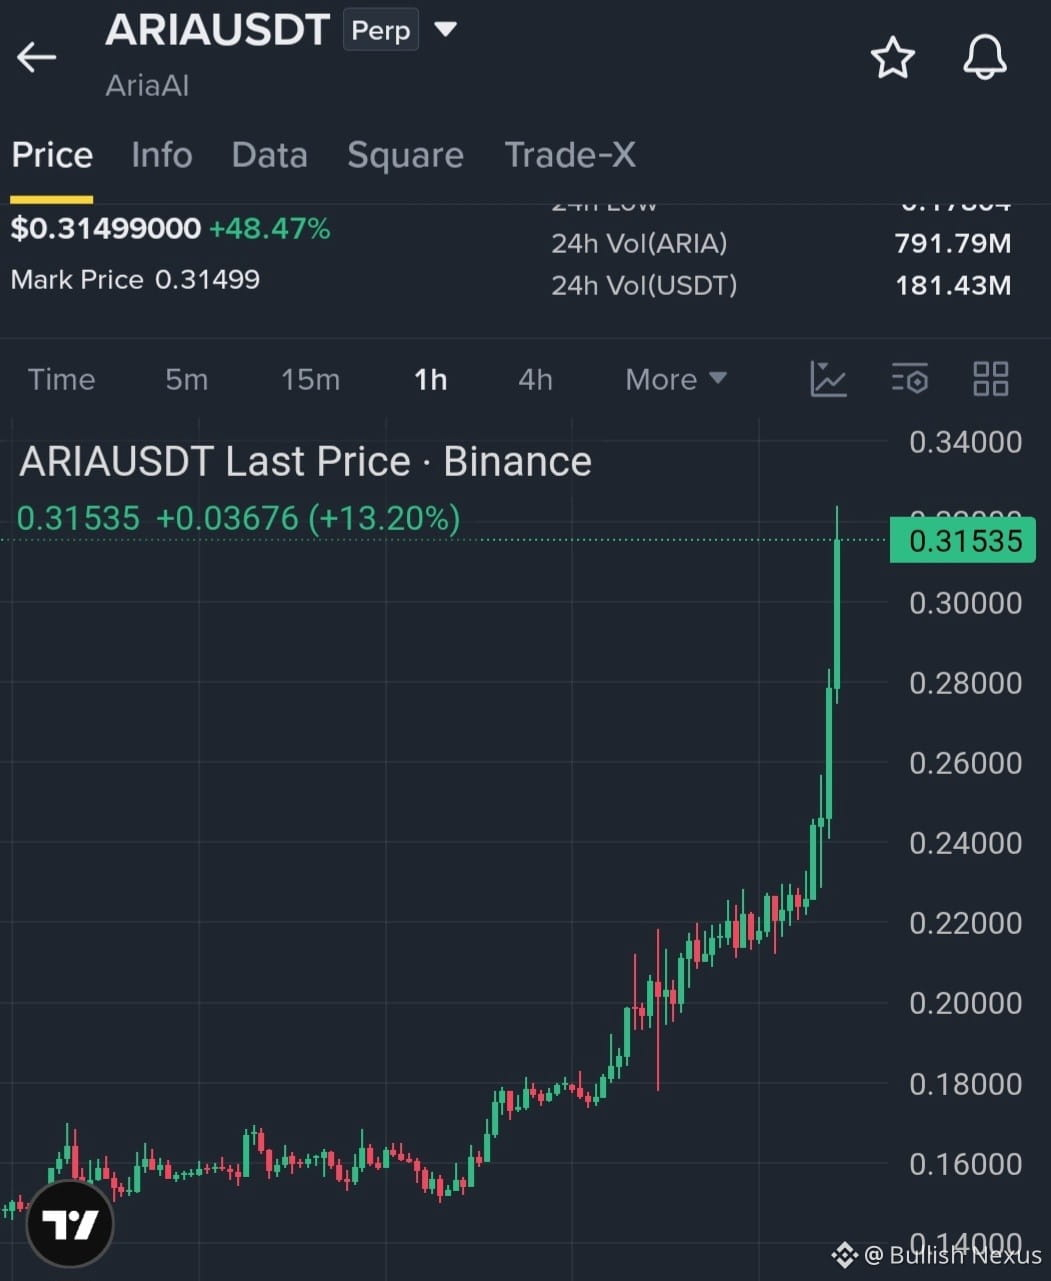
$ARIA has printed a massive parabolic rally, surging past +43% in 24 hours to test $0.3088. However, lower timeframe indicators signal extreme overbought momentum. Here is a breakdown of the 1H, 4H, and 1W charts with a structured trade plan.
📊 Technical Overview
1H & 4H Trend: Strongly Bullish, price trading well above MA(7) & MA(25).
RSI & Stoch RSI: Extreme Overbought (1H RSI: ~94.4 | 4H RSI: ~97.3).
Macro View (1W): Rebound from long-term lows (~$0.022), with room towards historical resistance at $0.41 - $0.63.
⚠️ Warning: Chasing the top (FOMO buying) at current market price ($0.304 - $0.308) carries high risk. A healthy cooling-off period / pullback is expected before the next leg up.
🎯 Trading Strategy & Setup Plan
Strategy A: Retracement / Pullback Entry (Highest Win Rate)
Wait for price to cool off to dynamic support zones before entering Long.
Primary Buy Zone: $0.245 - $0.250 (Near 1H MA7 Support)
Deep Re-entry Zone: $0.220 - $0.230 (Confluence near 4H MA7 & 1H MA25)
🎯 Take-Profit 1 (TP1): $0.308
🎯 Take-Profit 2 (TP2): $0.350
🎯 Take-Profit 3 (TP3): $0.410
🛑 Stop-Loss (SL): $0.215 (Below major 4H structural support)
Strategy B: Breakout Continuation (Aggressive)
🚀 Entry: 1H Candle Close above $0.310 with high buying volume.
🎯 Targets: $0.350 / $0.400
🛑 Stop-Loss: $0.288
💡 Risk Management Advice:
Use conservative leverage (3x – 5x max).
Risk only 1-2% of total capital.
Always trade with a strict Stop-Loss!
What are your thoughts on $ARIA? Is it going to reach $0.50 next, or will we see a sharp pullback first? Drop your predictions below! 👇
#ARIAUSDT
🚀 $ARIA/USDT Technical Analysis: Parabolic Expansion & Key Levels to Watch 🚀
$ARIA has printed a massive parabolic rally, surging past +43% in 24 hours to test $0.3088. However, lower timeframe indicators signal extreme overbought momentum. Here is a breakdown of the 1H, 4H, and 1W charts with a structured trade plan.
📊 Technical Overview
1H & 4H Trend: Strongly Bullish, price trading well above MA(7) & MA(25).
RSI & Stoch RSI: Extreme Overbought (1H RSI: ~94.4 | 4H RSI: ~97.3).
Macro View (1W): Rebound from long-term lows (~$0.022), with room towards historical resistance at $0.41 - $0.63.
⚠️ Warning: Chasing the top (FOMO buying) at current market price ($0.304 - $0.308) carries high risk. A healthy cooling-off period / pullback is expected before the next leg up.
🎯 Trading Strategy & Setup Plan
Strategy A: Retracement / Pullback Entry (Highest Win Rate)
Wait for price to cool off to dynamic support zones before entering Long.
Primary Buy Zone: $0.245 - $0.250 (Near 1H MA7 Support)
Deep Re-entry Zone: $0.220 - $0.230 (Confluence near 4H MA7 & 1H MA25)
🎯 Take-Profit 1 (TP1): $0.308
🎯 Take-Profit 2 (TP2): $0.350
🎯 Take-Profit 3 (TP3): $0.410
🛑 Stop-Loss (SL): $0.215 (Below major 4H structural support)
Strategy B: Breakout Continuation (Aggressive)
🚀 Entry: 1H Candle Close above $0.310 with high buying volume.
🎯 Targets: $0.350 / $0.400
🛑 Stop-Loss: $0.288
💡 Risk Management Advice:
Use conservative leverage (3x – 5x max).
Risk only 1-2% of total capital.
Always trade with a strict Stop-Loss!
What are your thoughts on $ARIA? Is it going to reach $0.50 next, or will we see a sharp pullback first? Drop your predictions below! 👇
#ARIAUSDT