What $BTC Did Every Time This Happened Before 📜
TL;DR: 74% of accounts are long. History leans down (2/11). Price 73,475.6, daily RSI 34.
📌 Key data points
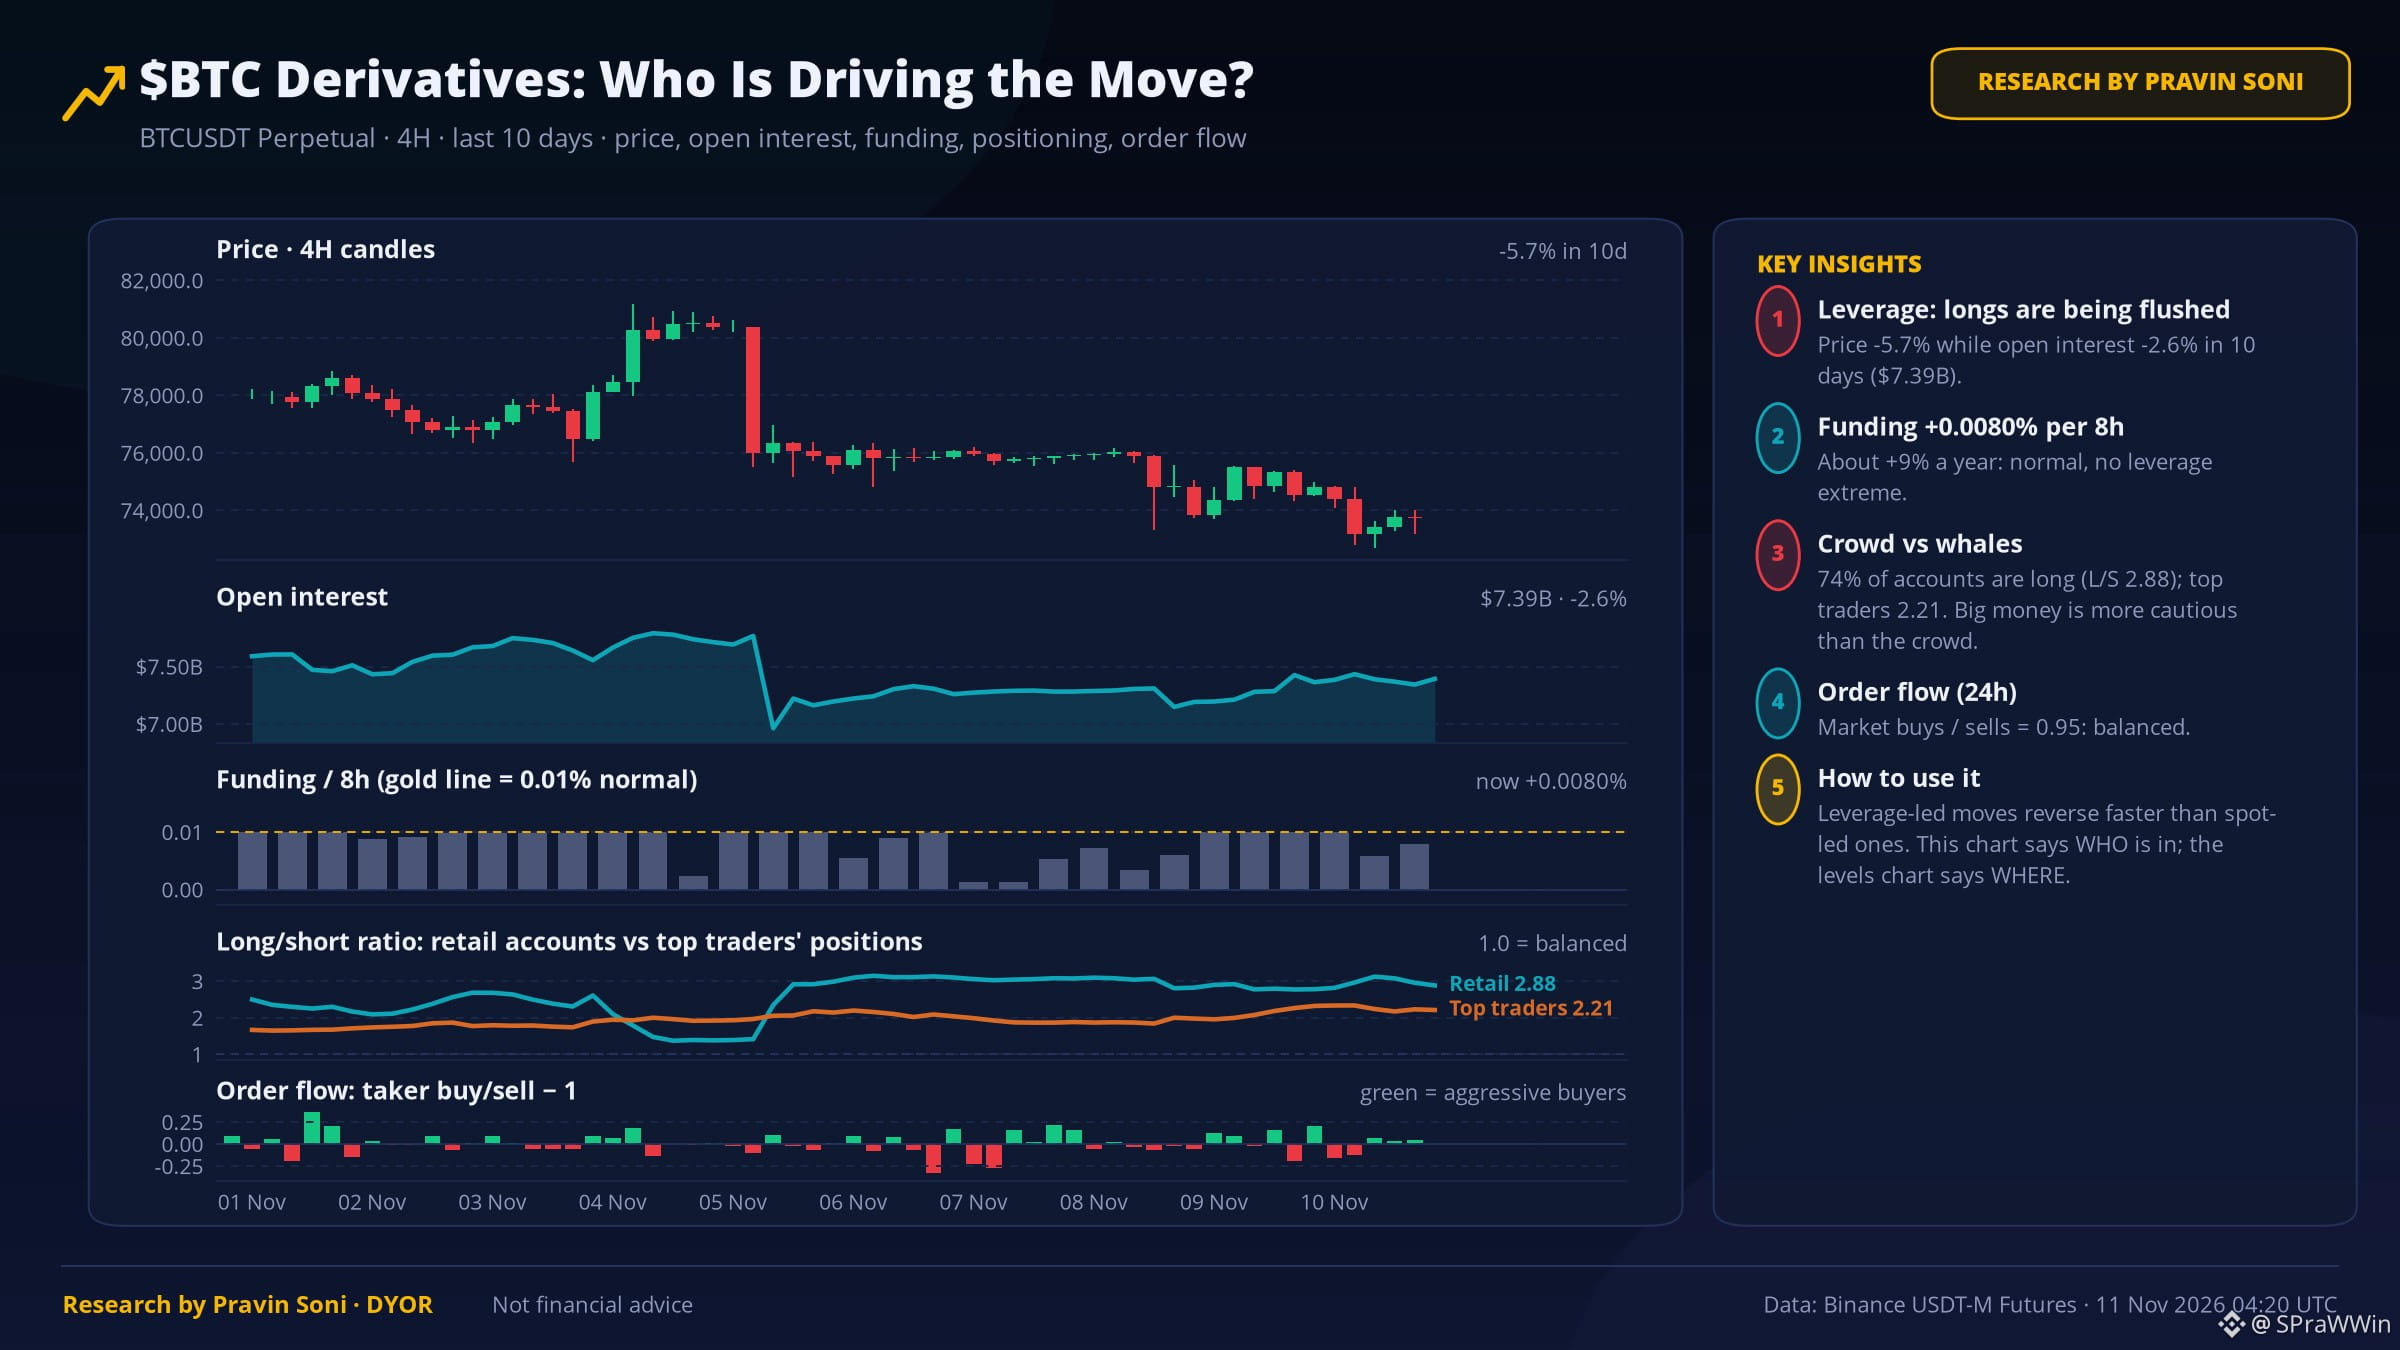
1️⃣ 74% of Binance accounts are long (L/S 2.88) — the crowd is one-sided, a contrarian warning.
🔁 Same setup, past results
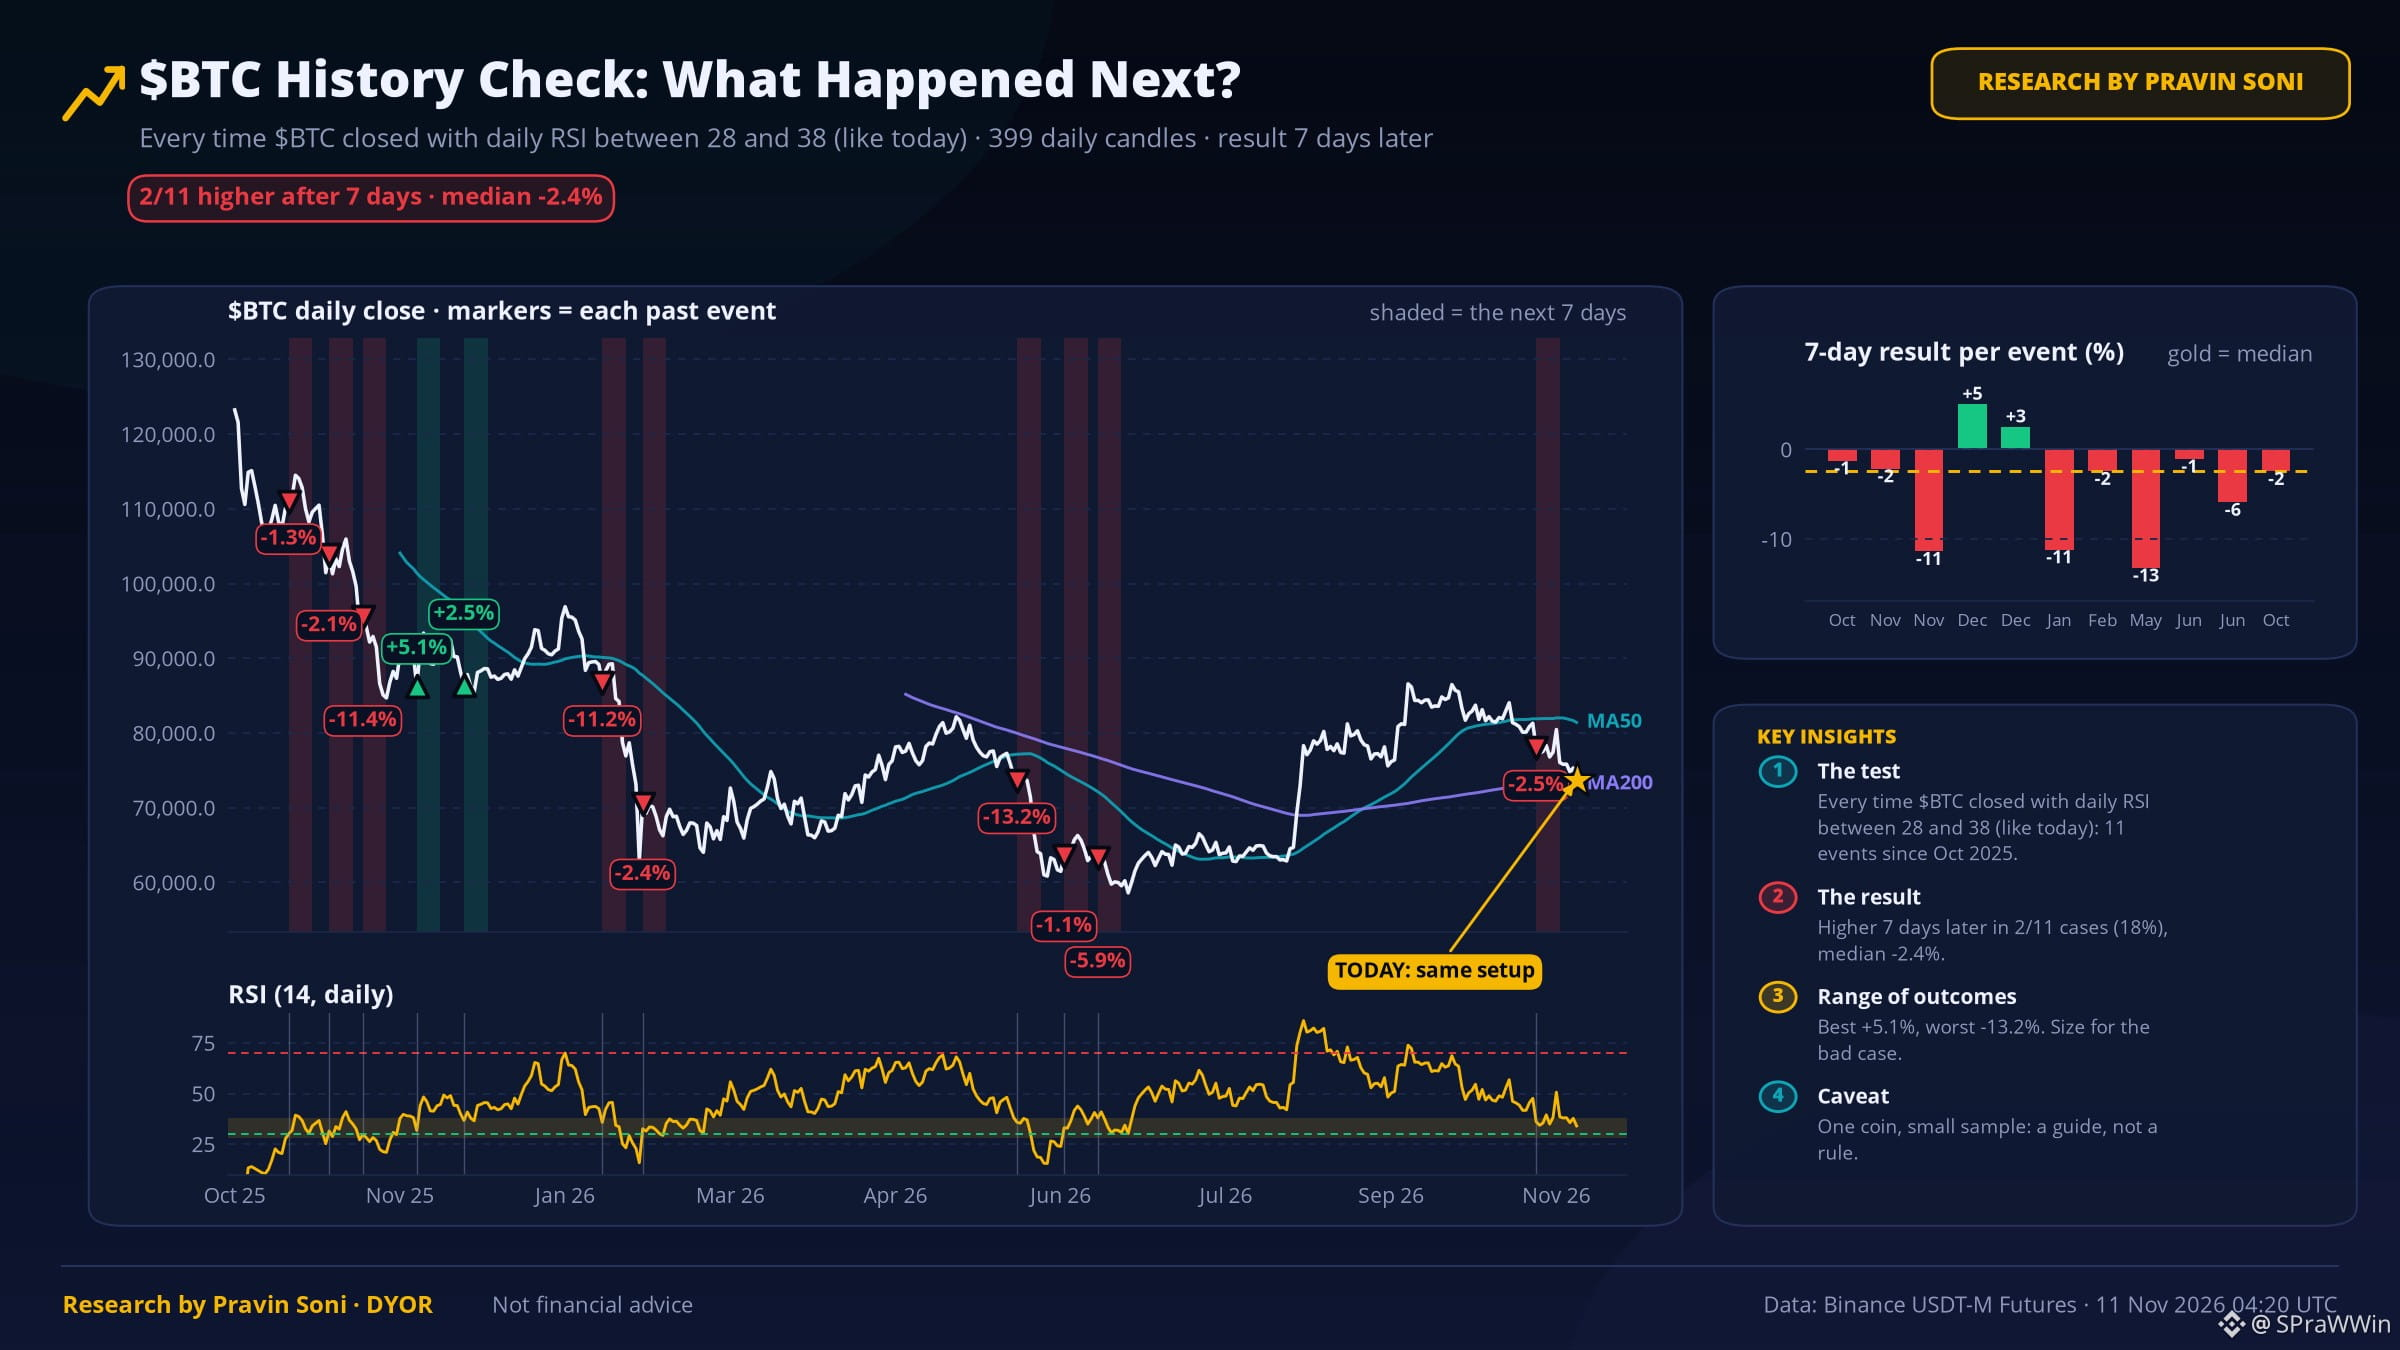
The last 11 times $BTC closed with daily RSI between 28 and 38 (like today), it was higher 7 days later in 2 of 11 cases (median -2.4%). Small sample, so a guide, not a rule.
📏 Volatility map (7 days)
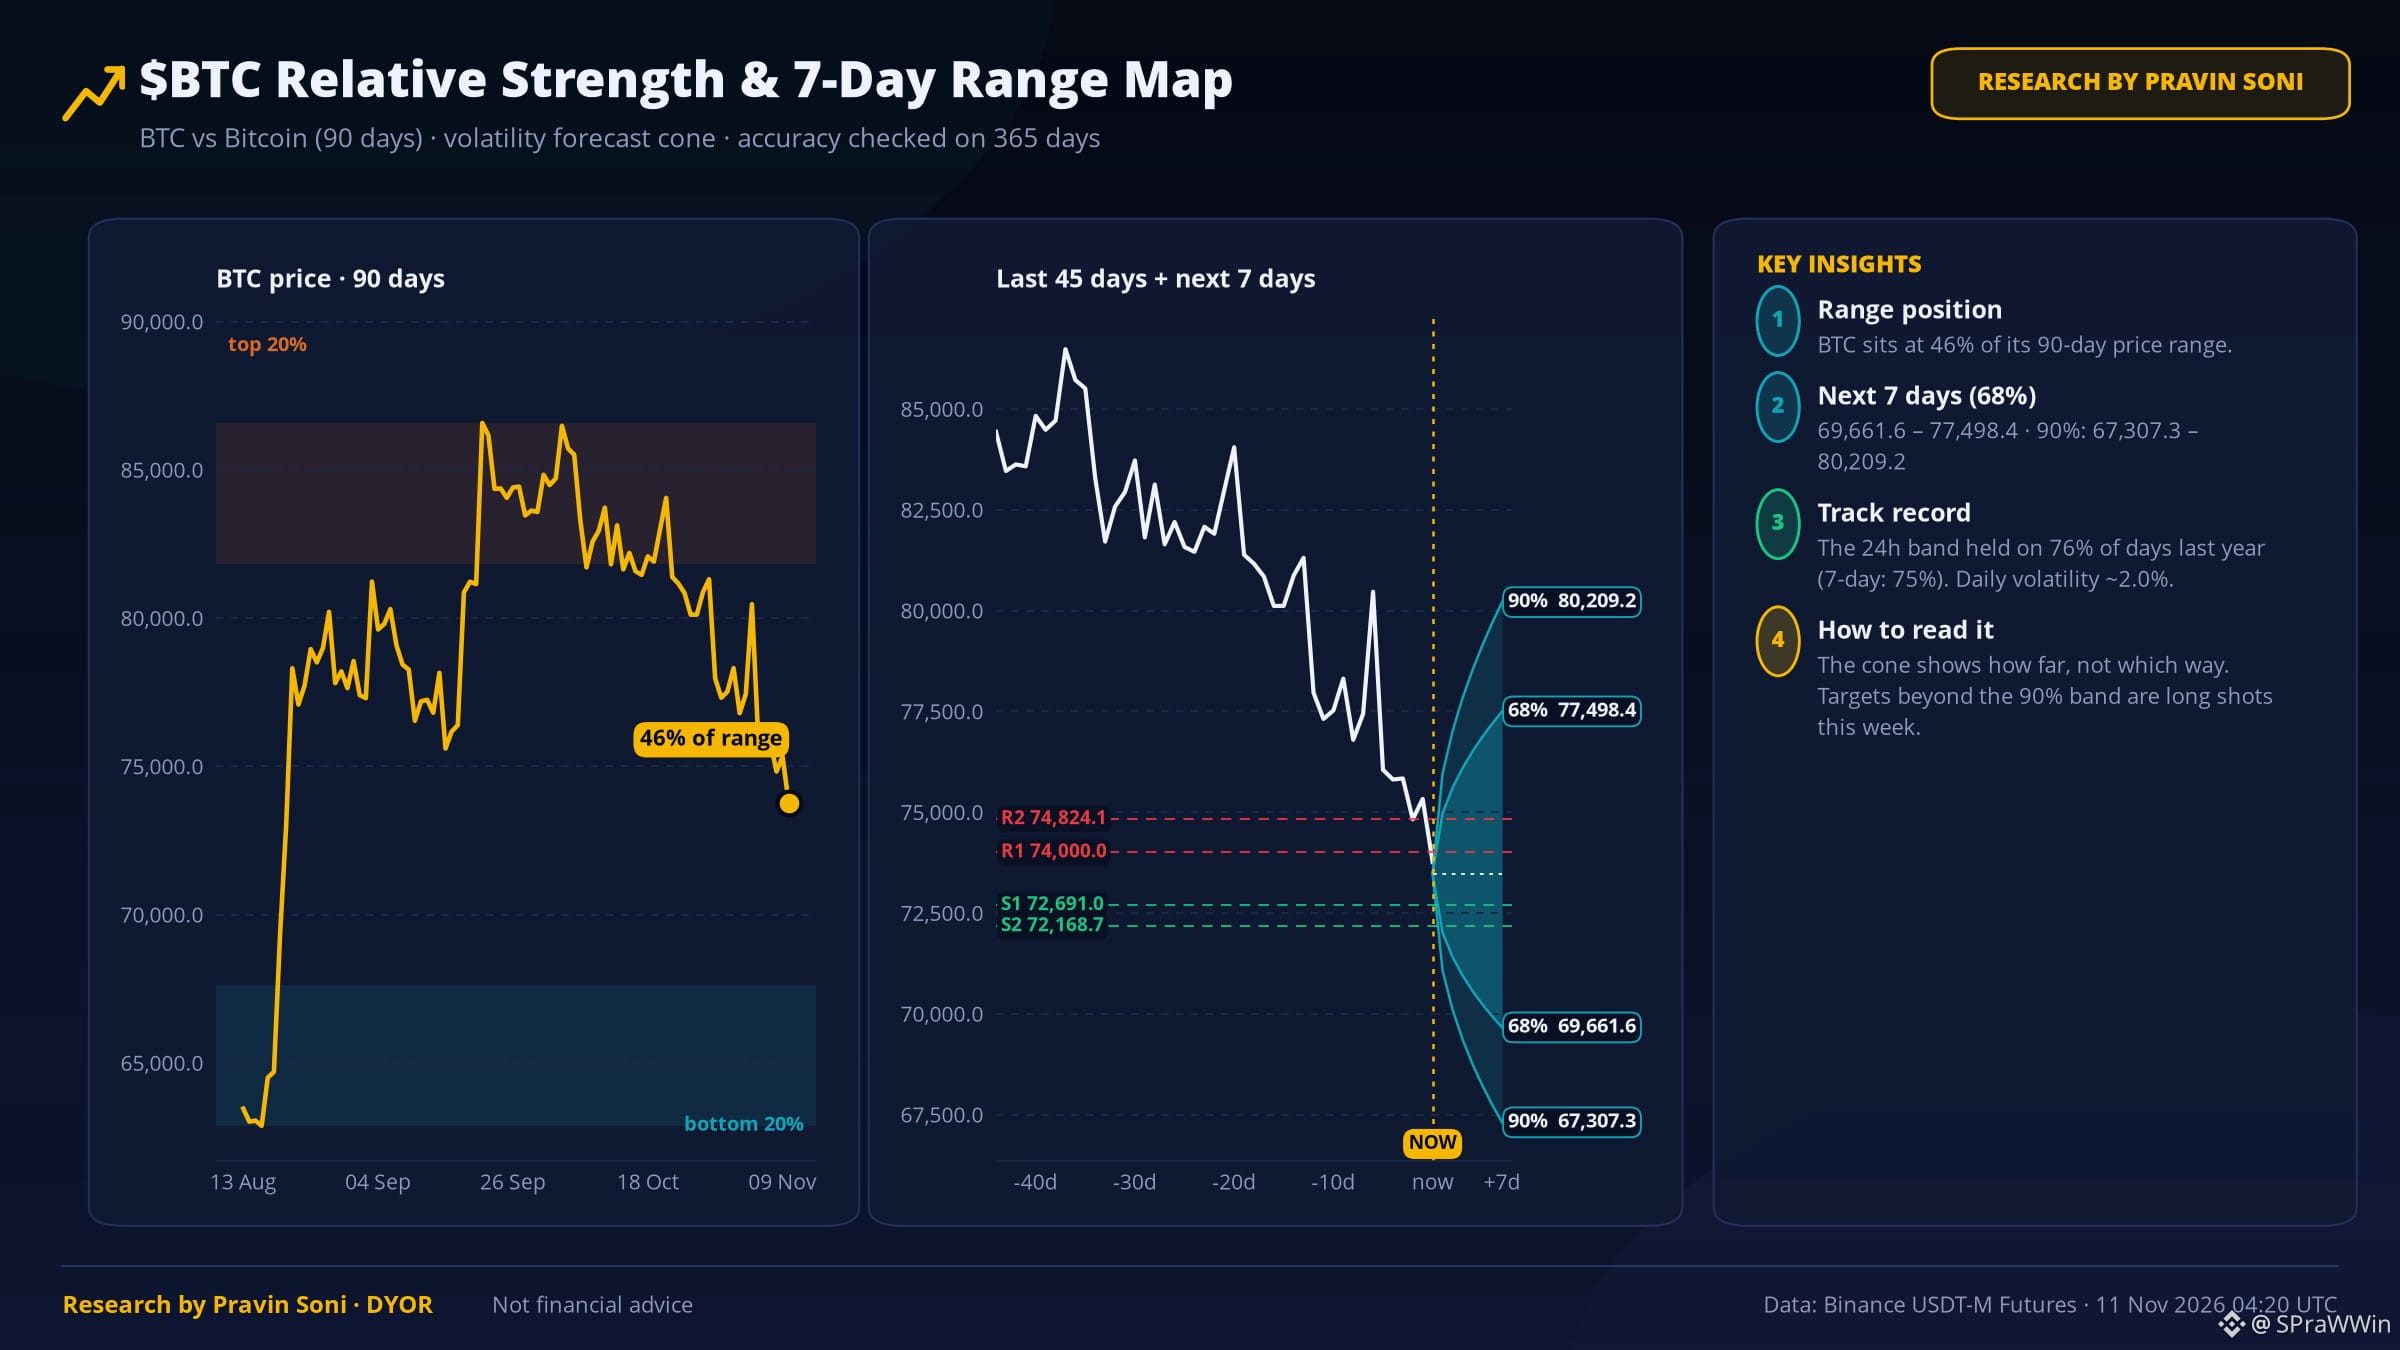
68% band: 69,661.6 – 77,498.4 · 90% band: 67,307.3 – 80,209.2
This band held on 76% of days last year. It shows how far, not which way.
🧭 Key levels to watch
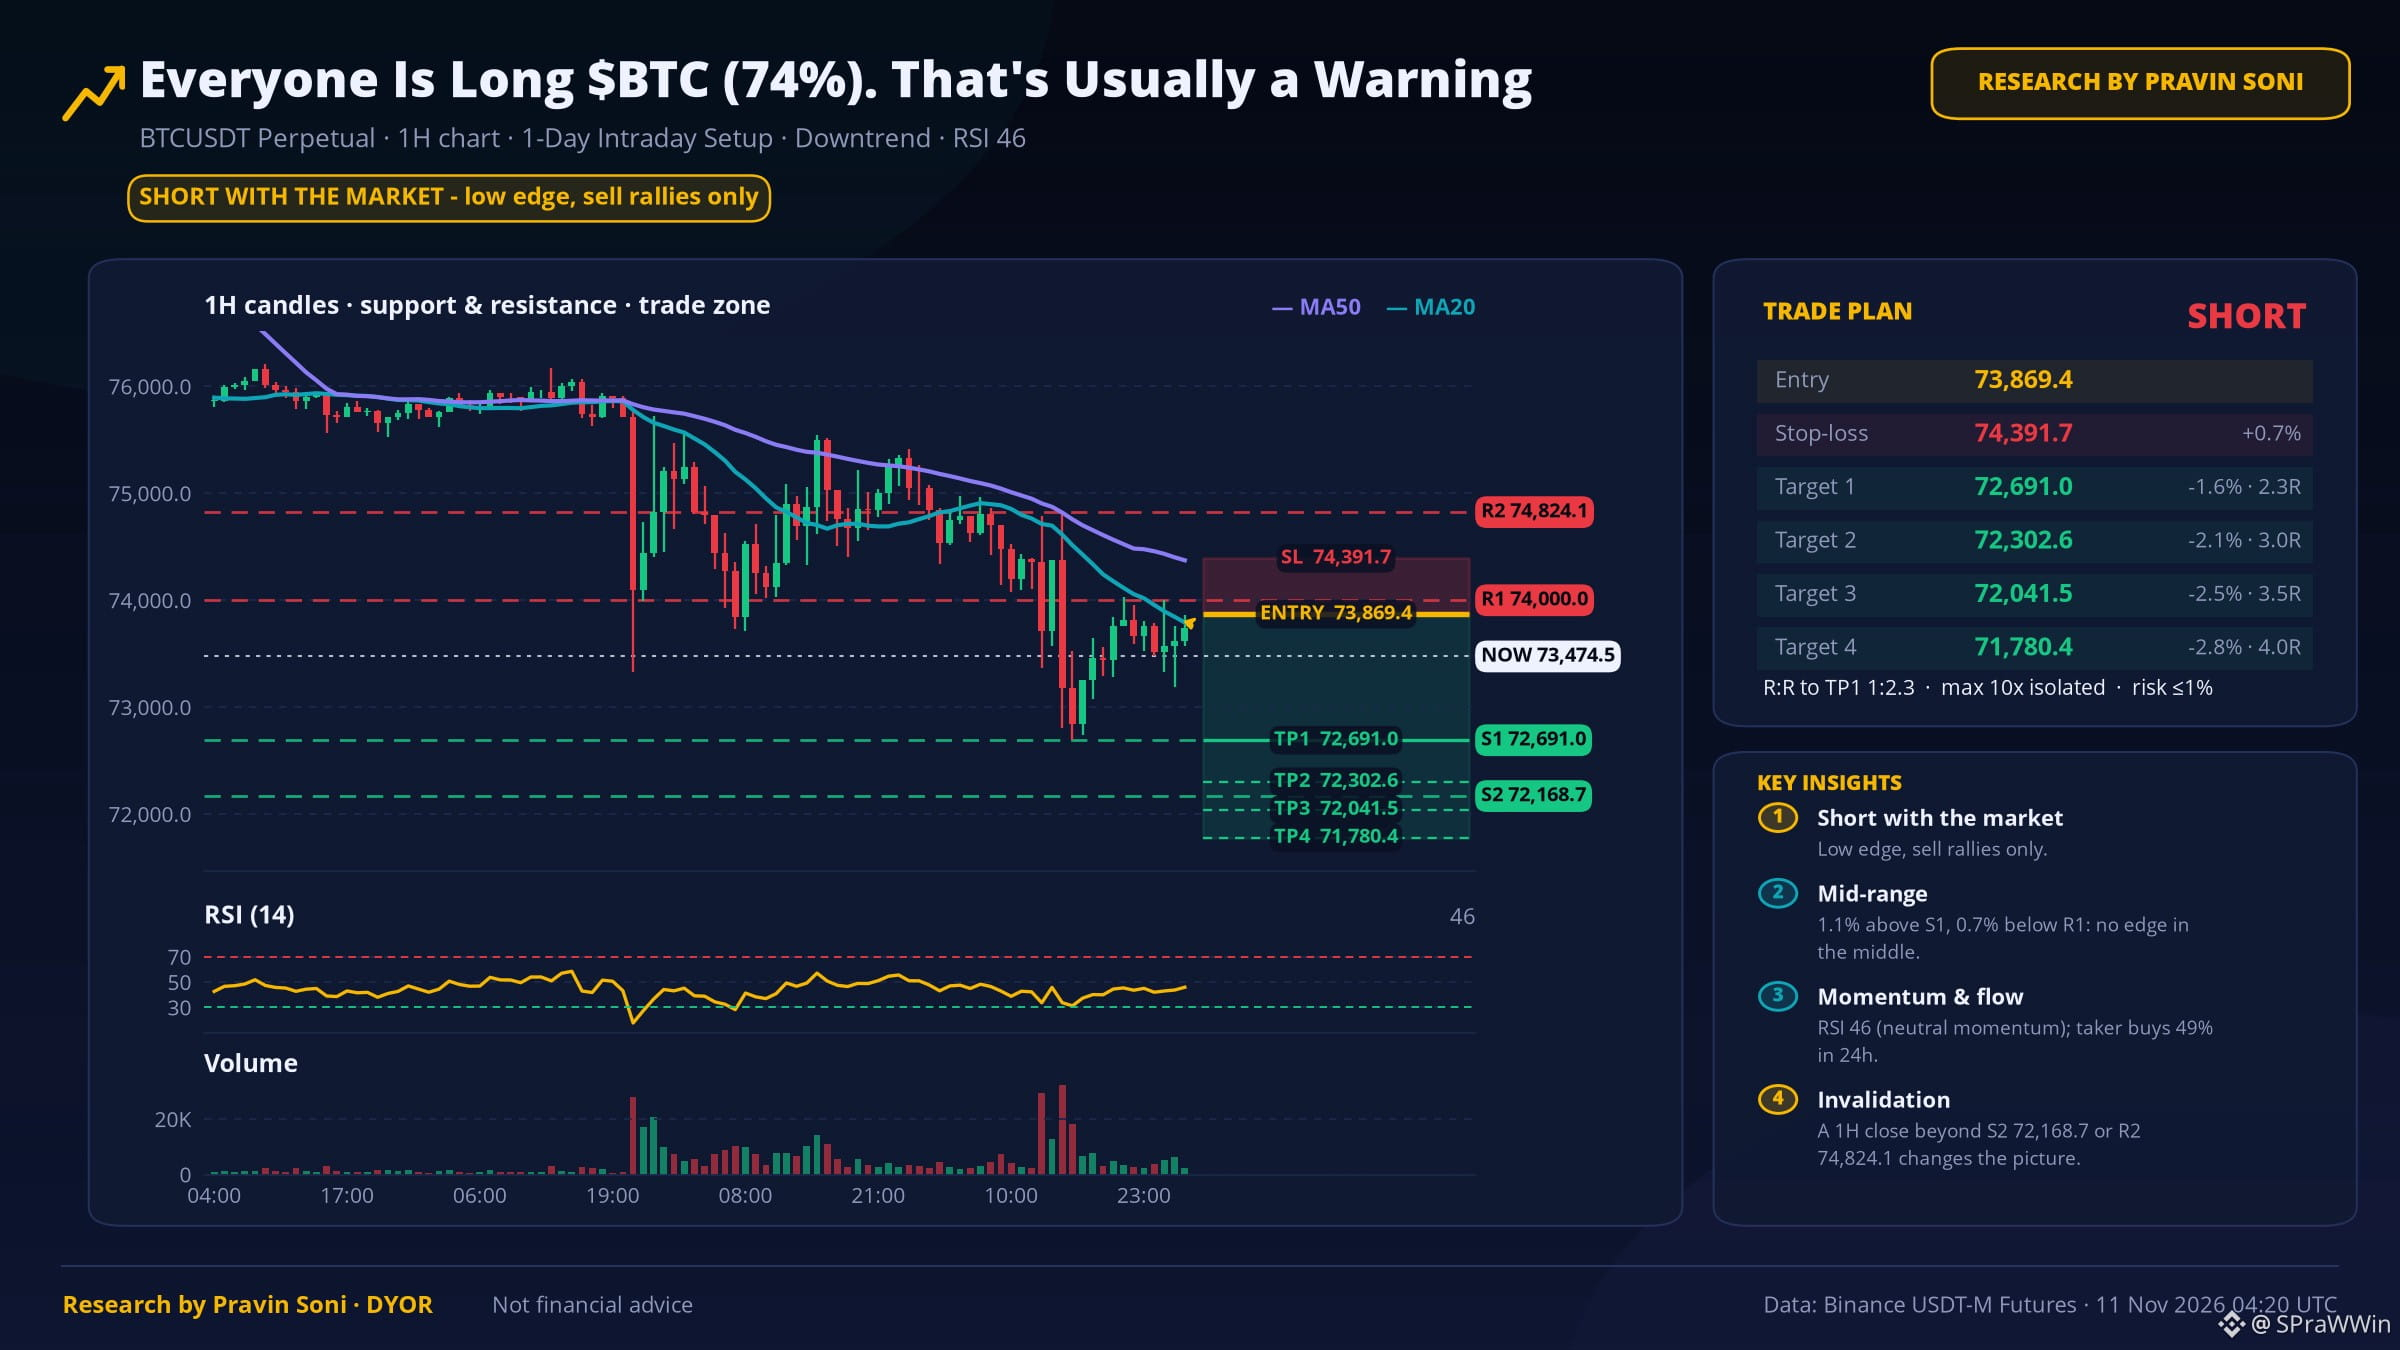
🟢 Bull case: daily close above 74,000.0 → 74,824.1
🔴 Bear case: daily close below 72,691.0 → 72,168.7
💡 How I see it: The data leans bearish. A daily close below 72,691.0 confirms it; reclaiming 74,000.0 proves me wrong.
📰 Wu Blockchain, 12h ago: CryptoQuant: USDT Market Cap Falls $6.6B in 60 Days as Crypto Liquidity Tightens According to CryptoQuant's November 10 report, USDT's market capitali…
💬 Would you trade this, or sit it out?
Not financial advice · Data: Binance Futures
$BTC #BTC #Sentiment #CryptoAnalysis
⚠️ Research by Pravin Soni - DYOR
TL;DR: 74% of accounts are long. History leans down (2/11). Price 73,475.6, daily RSI 34.
📌 Key data points
1️⃣ 74% of Binance accounts are long (L/S 2.88) — the crowd is one-sided, a contrarian warning.
🔁 Same setup, past results
The last 11 times $BTC closed with daily RSI between 28 and 38 (like today), it was higher 7 days later in 2 of 11 cases (median -2.4%). Small sample, so a guide, not a rule.
📏 Volatility map (7 days)
68% band: 69,661.6 – 77,498.4 · 90% band: 67,307.3 – 80,209.2
This band held on 76% of days last year. It shows how far, not which way.
🧭 Key levels to watch
🟢 Bull case: daily close above 74,000.0 → 74,824.1
🔴 Bear case: daily close below 72,691.0 → 72,168.7
💡 How I see it: The data leans bearish. A daily close below 72,691.0 confirms it; reclaiming 74,000.0 proves me wrong.
📰 Wu Blockchain, 12h ago: CryptoQuant: USDT Market Cap Falls $6.6B in 60 Days as Crypto Liquidity Tightens According to CryptoQuant's November 10 report, USDT's market capitali…
💬 Would you trade this, or sit it out?
Not financial advice · Data: Binance Futures
$BTC #BTC #Sentiment #CryptoAnalysis
⚠️ Research by Pravin Soni - DYOR