DAILY SIGNAL — SOL/USDT
Date: 11 Nov 2026
Chart Time: 02:19 UTC+8
Timeframe: 1m
Intraday Bias: Short-term recovery → resistance test
---
📊 MARKET BIAS
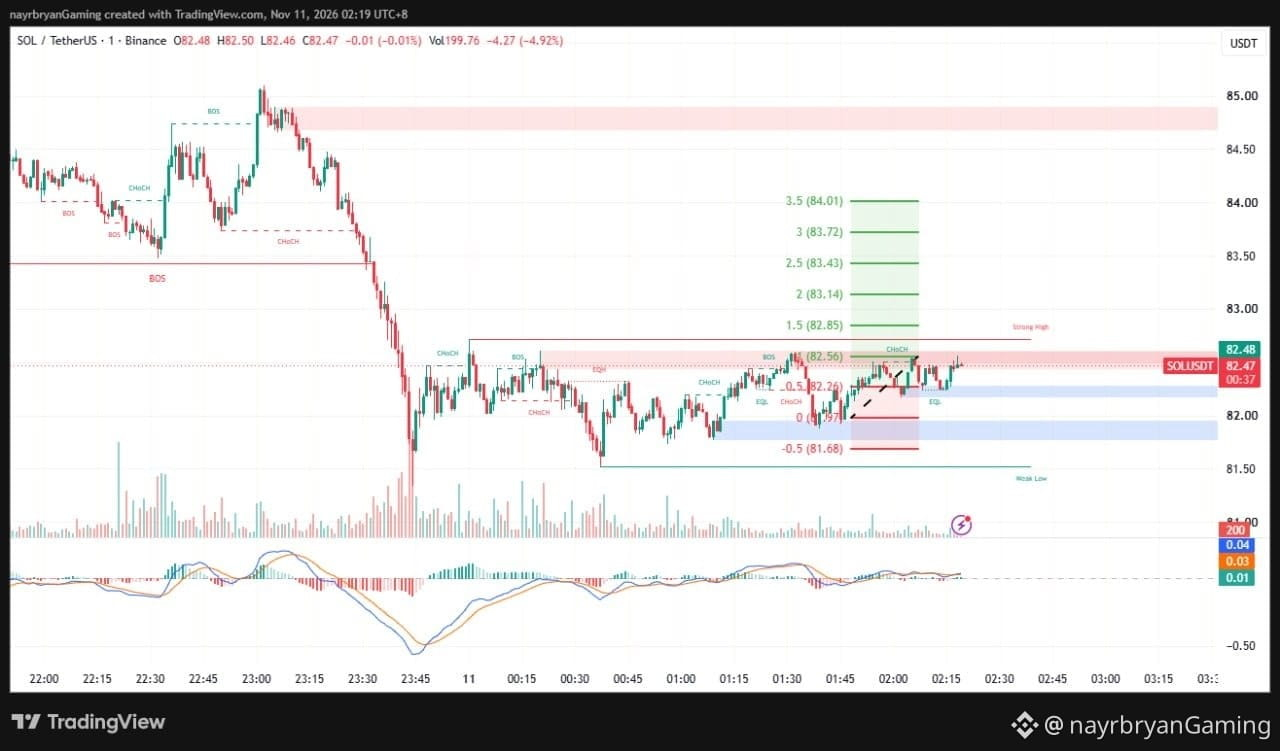
SOL is attempting a short-term recovery after experiencing a significant bearish move from the 85.00 region toward the 81.50 area.
Following the sharp sell-off, price established a consolidation range and gradually recovered through a series of higher lows.
SOL is currently trading around 82.47, approaching an important resistance and supply area around 82.45–82.60.
The current structure presents a critical decision point.
Buyers are attempting to maintain upward momentum, while sellers may defend the nearby supply zone.
A confirmed breakout could expose the upper Fibonacci extension levels.
However, rejection from resistance could send price back toward the lower support zones.
---
🔹 KEY LEVELS FROM CHART
Current Price:
82.47
Immediate Resistance:
82.50–82.56
Key Supply Zone:
82.45–82.60
Major Resistance:
82.70–82.85
Initial Support:
82.26
Major Support Zone:
82.20–82.30
Secondary Support:
81.80–81.95
Weak-Low Reference:
81.50
---
🎯 FIBONACCI LEVELS
Upside Extensions:
TP1 → 82.56 (1.0 Fib)
TP2 → 82.85 (1.5 Fib)
TP3 → 83.14 (2.0 Fib)
TP4 → 83.43 (2.5 Fib)
TP5 → 83.72 (3.0 Fib)
TP6 → 84.01 (3.5 Fib)
Downside References:
82.26 (0.5 Fib)
81.97 (0 Fib)
81.68 (-0.5 Fib)
These are conditional technical reference levels, not guaranteed targets.
---
📈 TECHNICAL BREAKDOWN
1. Price Structure
SOL experienced a strong bearish decline from the 85.00 region, followed by a sharp reaction around 81.50–81.70.
---
🧠 QUICK INSIGHT
"Recovery creates opportunity, but resistance determines whether momentum can survive."
---
⚠️ DISCLAIMER
This is personal market analysis, not financial advice.
This chart framework is for educational purposes only.
Always DYOR / DYODD, manage risk properly, and avoid emotional trading.
— @nayrbryanGaming
#SOL #SOLUSDT #Crypto #Trading #TechnicalAnalysis #PriceAction #SmartMoney #Fibonacci #Binance #MACD #MarketStructure #DYOR #NFA #NoFOMO
Date: 11 Nov 2026
Chart Time: 02:19 UTC+8
Timeframe: 1m
Intraday Bias: Short-term recovery → resistance test
---
📊 MARKET BIAS
SOL is attempting a short-term recovery after experiencing a significant bearish move from the 85.00 region toward the 81.50 area.
Following the sharp sell-off, price established a consolidation range and gradually recovered through a series of higher lows.
SOL is currently trading around 82.47, approaching an important resistance and supply area around 82.45–82.60.
The current structure presents a critical decision point.
Buyers are attempting to maintain upward momentum, while sellers may defend the nearby supply zone.
A confirmed breakout could expose the upper Fibonacci extension levels.
However, rejection from resistance could send price back toward the lower support zones.
---
🔹 KEY LEVELS FROM CHART
Current Price:
82.47
Immediate Resistance:
82.50–82.56
Key Supply Zone:
82.45–82.60
Major Resistance:
82.70–82.85
Initial Support:
82.26
Major Support Zone:
82.20–82.30
Secondary Support:
81.80–81.95
Weak-Low Reference:
81.50
---
🎯 FIBONACCI LEVELS
Upside Extensions:
TP1 → 82.56 (1.0 Fib)
TP2 → 82.85 (1.5 Fib)
TP3 → 83.14 (2.0 Fib)
TP4 → 83.43 (2.5 Fib)
TP5 → 83.72 (3.0 Fib)
TP6 → 84.01 (3.5 Fib)
Downside References:
82.26 (0.5 Fib)
81.97 (0 Fib)
81.68 (-0.5 Fib)
These are conditional technical reference levels, not guaranteed targets.
---
📈 TECHNICAL BREAKDOWN
1. Price Structure
SOL experienced a strong bearish decline from the 85.00 region, followed by a sharp reaction around 81.50–81.70.
---
🧠 QUICK INSIGHT
"Recovery creates opportunity, but resistance determines whether momentum can survive."
---
⚠️ DISCLAIMER
This is personal market analysis, not financial advice.
This chart framework is for educational purposes only.
Always DYOR / DYODD, manage risk properly, and avoid emotional trading.
— @nayrbryanGaming
#SOL #SOLUSDT #Crypto #Trading #TechnicalAnalysis #PriceAction #SmartMoney #Fibonacci #Binance #MACD #MarketStructure #DYOR #NFA #NoFOMO