
$BTC Liquidity Is Building on Both Sides
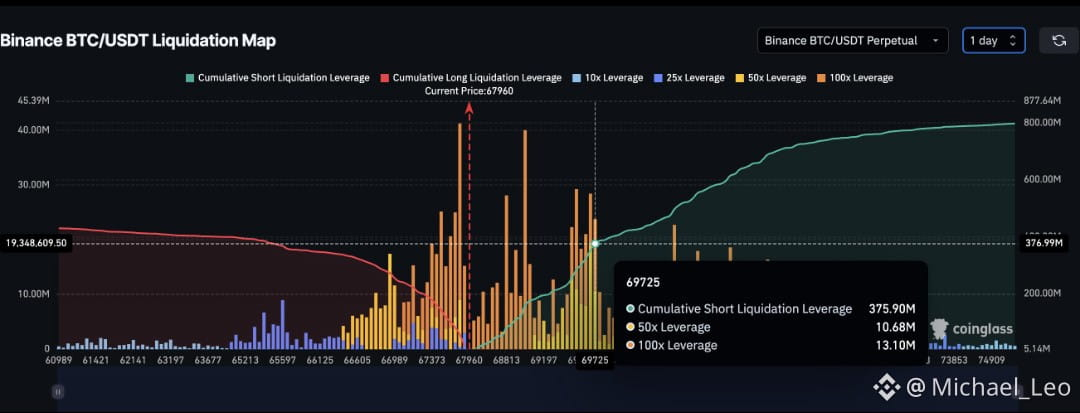
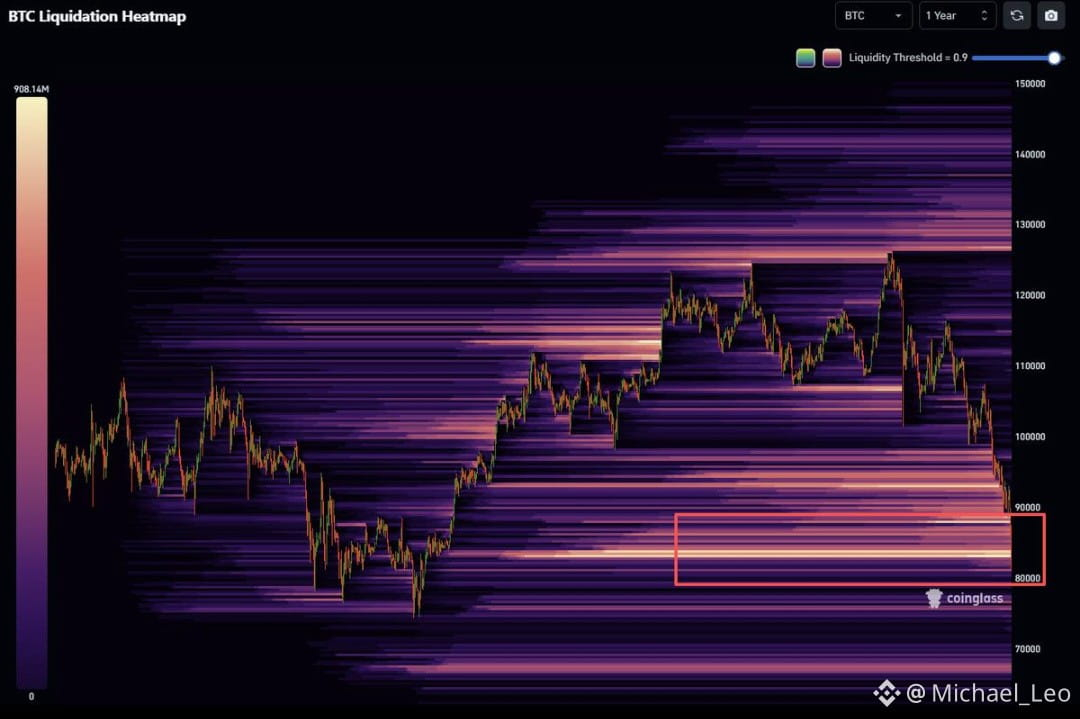
Bitcoin is approaching two important liquidation zones, and leveraged traders could be caught on either side.
As of November 10, 10:58 UTC, BTC was trading around $74,206. Estimated liquidation data highlights two major clusters:
Above current price:
$75,593 — approximately $76.7M in short liquidations.
$75,705–$75,761 — additional short-side liquidity.
Below current price:
$73,859 — approximately $79.8M in long liquidations.
$73,803 — approximately $77M in long liquidations.
The overlooked detail is that the largest nearby long-liquidation cluster is slightly bigger than the largest short cluster.
This creates two potential liquidity targets. A move upward could pressure short sellers, while a breakdown could force overleveraged longs to close.
These are estimated liquidation levels, not guaranteed execution points.
Which side gets swept first: BTC longs or shorts?
$BTC
Bitcoin is approaching two important liquidation zones, and leveraged traders could be caught on either side.
As of November 10, 10:58 UTC, BTC was trading around $74,206. Estimated liquidation data highlights two major clusters:
Above current price:
$75,593 — approximately $76.7M in short liquidations.
$75,705–$75,761 — additional short-side liquidity.
Below current price:
$73,859 — approximately $79.8M in long liquidations.
$73,803 — approximately $77M in long liquidations.
The overlooked detail is that the largest nearby long-liquidation cluster is slightly bigger than the largest short cluster.
This creates two potential liquidity targets. A move upward could pressure short sellers, while a breakdown could force overleveraged longs to close.
These are estimated liquidation levels, not guaranteed execution points.
Which side gets swept first: BTC longs or shorts?
$BTC