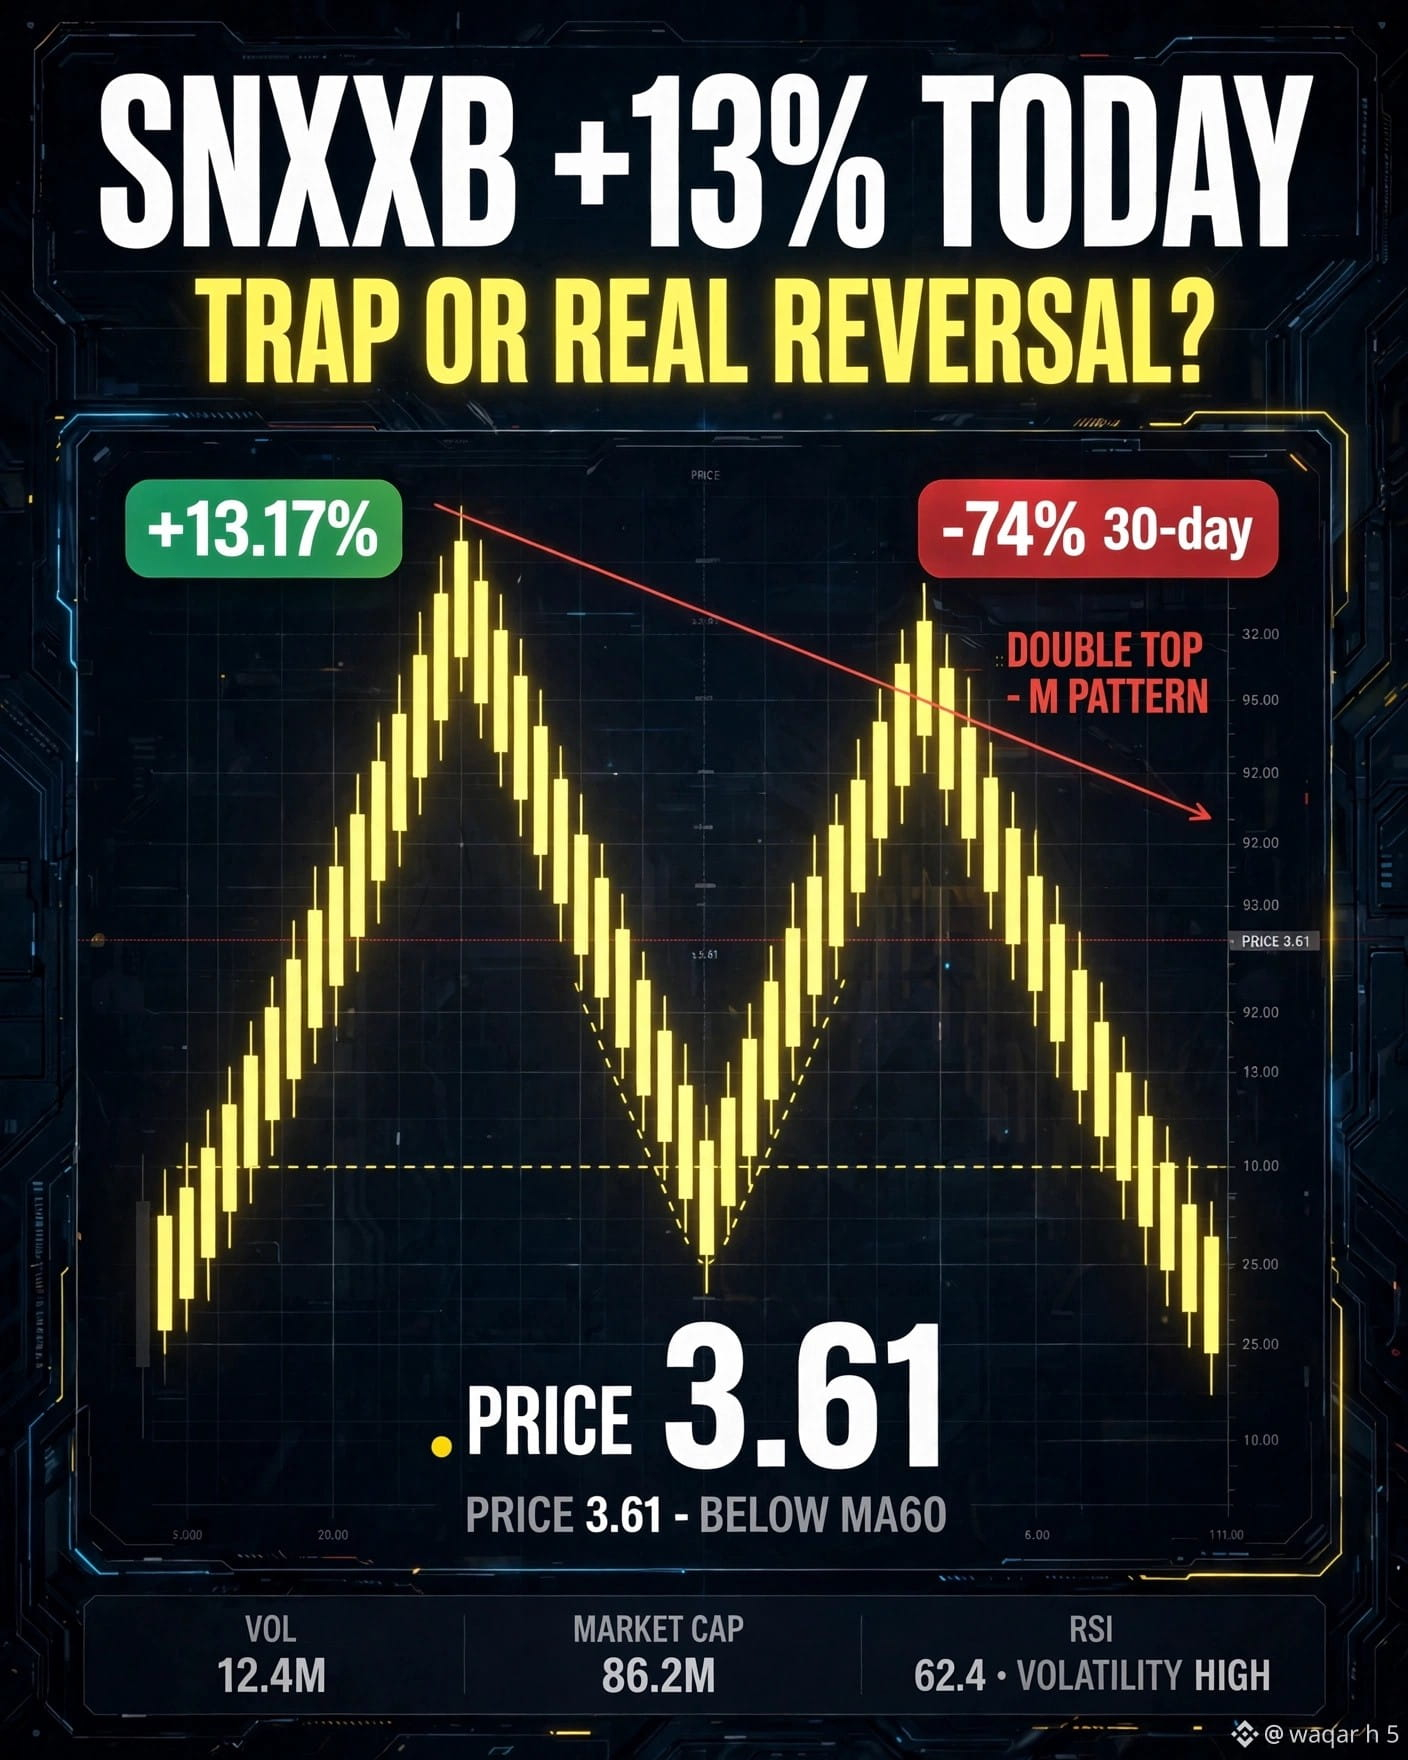
$SNXXB +13.17% TODAY — TRAP OR REAL REVERSAL? 👀
Look at this chart carefully.
Price right now: $3.61
24h High: $3.81
24h Low: $3.13
Today it looks green, but the full picture is different:
Today: +13.17% ✅
7 Days: -41.77% ❌
30 Days: -74.08% ❌
90 Days: -63.57% ❌
And see the chart? It made a clear "M" pattern — Double Top.
Price is still BELOW MA60 (3.62).
This is exactly where most traders get trapped. They see +13% and FOMO buy, then price dumps again.
My take: This is NOT a reversal yet. It's just a bounce inside a downtrend. Until price breaks and holds above 3.81, I am not bullish.
What's your call?
Comment: TRAP or REVERSAL? 👇
And are you holding or watching?
Follow for real chart breakdowns, not hype.
#SNXXB #crypto #Trading #BinanceSquare #dyor
Look at this chart carefully.
Price right now: $3.61
24h High: $3.81
24h Low: $3.13
Today it looks green, but the full picture is different:
Today: +13.17% ✅
7 Days: -41.77% ❌
30 Days: -74.08% ❌
90 Days: -63.57% ❌
And see the chart? It made a clear "M" pattern — Double Top.
Price is still BELOW MA60 (3.62).
This is exactly where most traders get trapped. They see +13% and FOMO buy, then price dumps again.
My take: This is NOT a reversal yet. It's just a bounce inside a downtrend. Until price breaks and holds above 3.81, I am not bullish.
What's your call?
Comment: TRAP or REVERSAL? 👇
And are you holding or watching?
Follow for real chart breakdowns, not hype.
#SNXXB #crypto #Trading #BinanceSquare #dyor