
$SOXSB · MARKET STRUCTURE
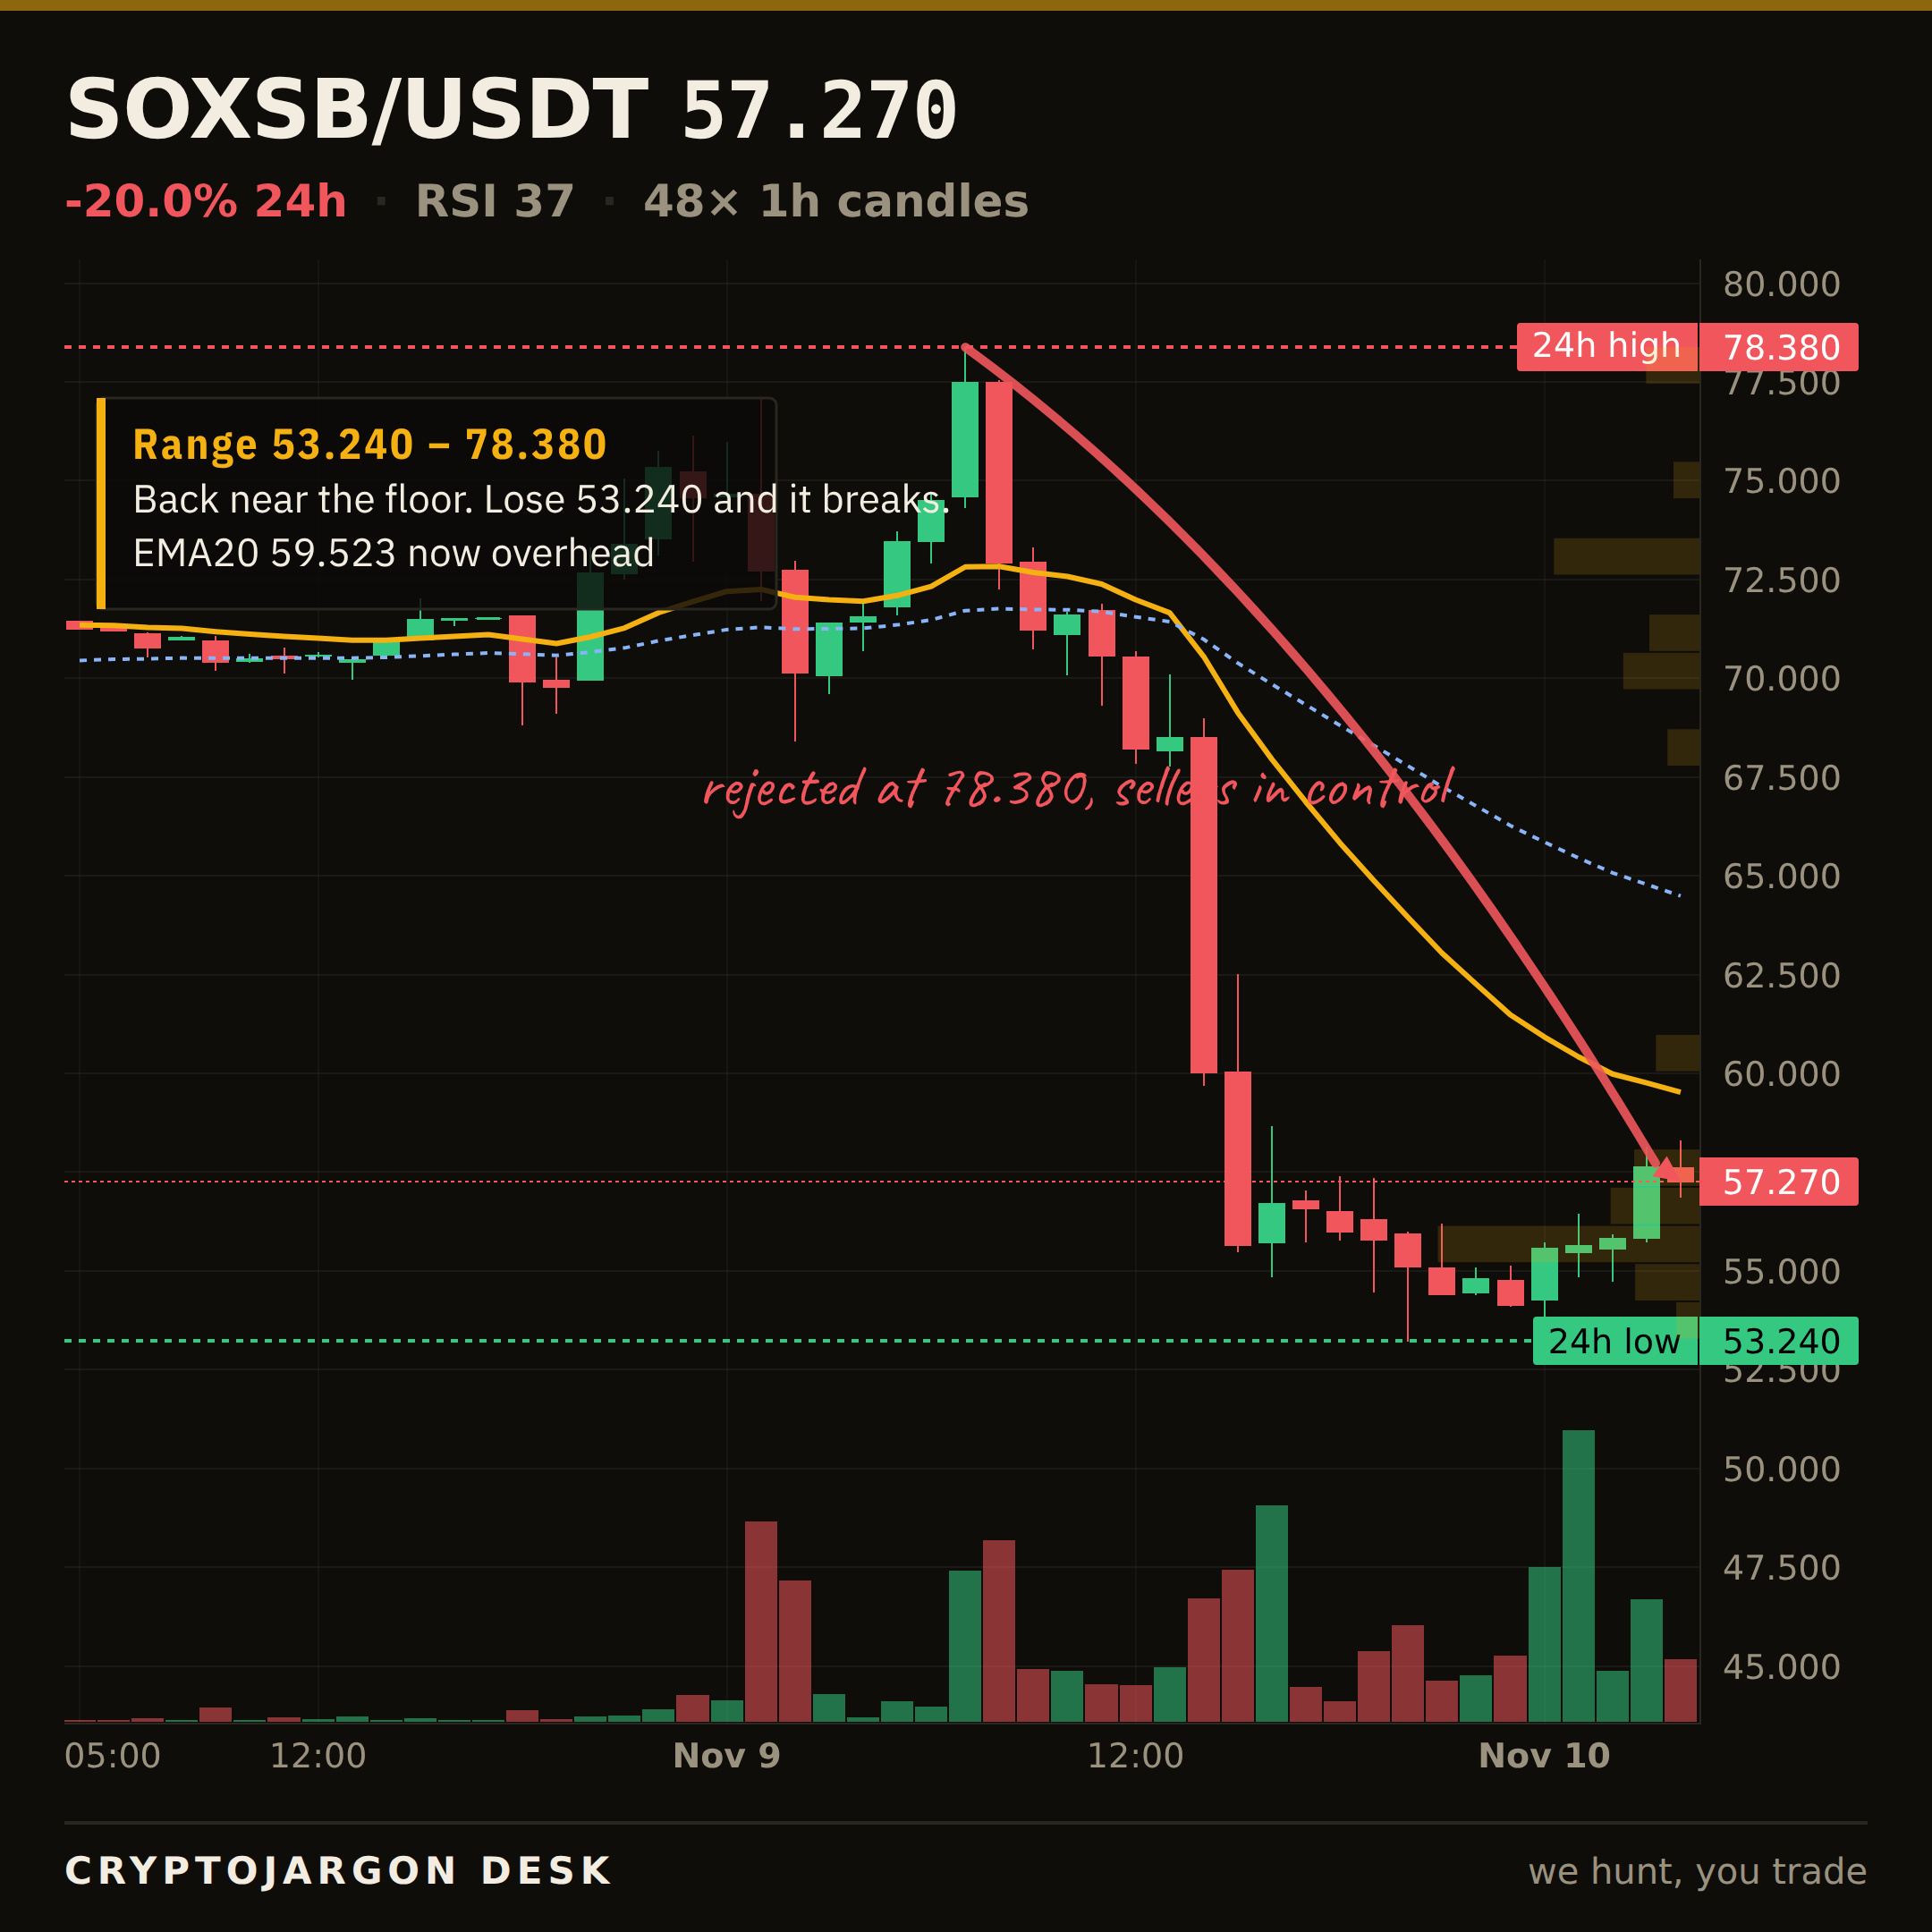
$57.27, -20.0% on the day.
Trend — price below both EMAs, the 20 under the 50.
Momentum — RSI 37.
Range — 16% up its 24h range ($53.24–$78.38).
Trend, momentum and range mostly point the same way — an aligned tape to the downside.
Levels: $78.38 24h high (ceiling) · $53.24 24h low (support) · 7d range $49.47–$85.26.
Chart: 1H candles, EMA20/50 + levels marked. $SOXSB
$57.27, -20.0% on the day.
Trend — price below both EMAs, the 20 under the 50.
Momentum — RSI 37.
Range — 16% up its 24h range ($53.24–$78.38).
Trend, momentum and range mostly point the same way — an aligned tape to the downside.
Levels: $78.38 24h high (ceiling) · $53.24 24h low (support) · 7d range $49.47–$85.26.
Chart: 1H candles, EMA20/50 + levels marked. $SOXSB