$ASTER: The Risks of the Lone Witness
Deciding on a trade after looking at one chart pattern is like a detective arresting the first person seen at a crime scene. In this thought experiment, the indicator acts as a single witness. While the witness might be telling the truth, a narrow perspective often misses the broader context. Relying solely on one signal creates a fragile hypothesis that lacks the strength of corroboration.
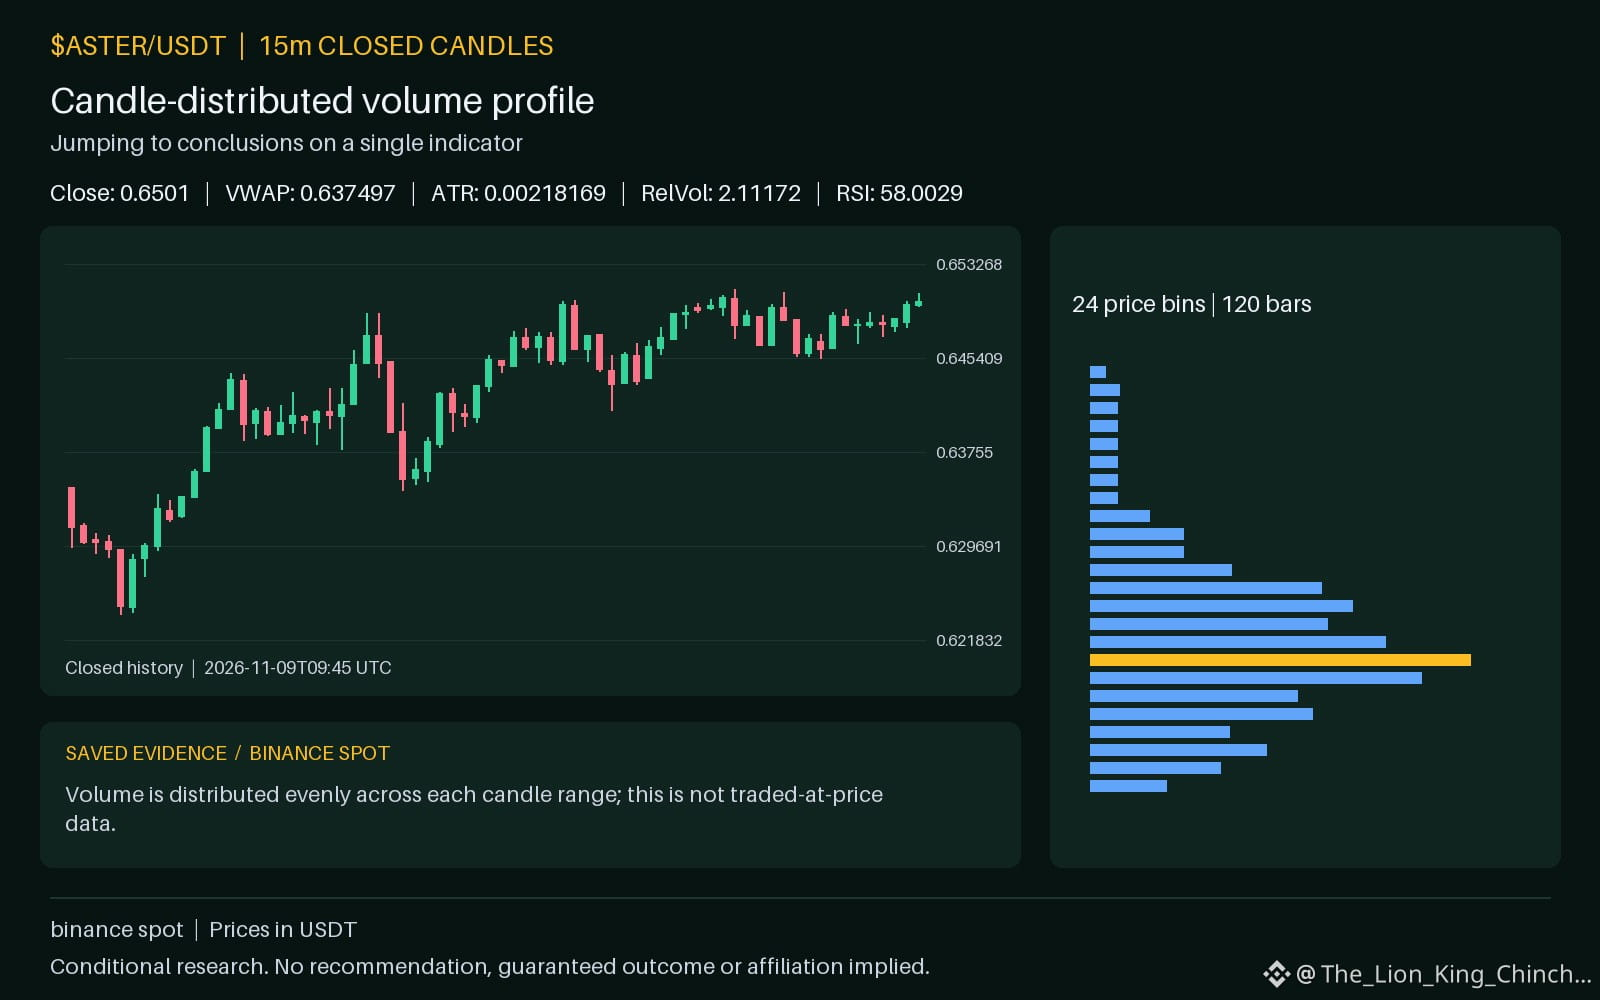
Consider a hypothetical scenario where an asset shows daily movement above the 0.648117. A researcher might assume this indicates a persistent trend. However, without looking at relative volume 2.11172 or the RSI 58.0029, they ignore the energy behind the move. If volume is thin, the price change could be a fluke rather than a shift in momentum. For $ASTER, we observe the hourly direction is up and volume is above baseline, yet the price stays inside the recorded range. This divergence shows why one fact needs another to form a complete picture.
To reassess an interpretation, try a counterexample. If your primary indicator suggests an entry, look for a second metric like the MACD 0.000983826 to see if it provides a conflicting story. Testing your idea against multiple data points helps filter out noise. By requiring two witnesses to agree, you reduce the chance of jumping to conclusions based on a partial view. This patient approach treats data as a puzzle where every piece must fit before the image is clear.
Probabilistic market research, not a recommendation or guaranteed return.
The comparison to keep in mind: $ETH has hourly direction down and volume above its baseline; $INIT has hourly direction down and volume above its baseline. This alone does not establish correlation.
If you treated your favorite indicator like a single witness in a detective case, what second witness would you call to verify its story?
#ASTER
Deciding on a trade after looking at one chart pattern is like a detective arresting the first person seen at a crime scene. In this thought experiment, the indicator acts as a single witness. While the witness might be telling the truth, a narrow perspective often misses the broader context. Relying solely on one signal creates a fragile hypothesis that lacks the strength of corroboration.
Consider a hypothetical scenario where an asset shows daily movement above the 0.648117. A researcher might assume this indicates a persistent trend. However, without looking at relative volume 2.11172 or the RSI 58.0029, they ignore the energy behind the move. If volume is thin, the price change could be a fluke rather than a shift in momentum. For $ASTER, we observe the hourly direction is up and volume is above baseline, yet the price stays inside the recorded range. This divergence shows why one fact needs another to form a complete picture.
To reassess an interpretation, try a counterexample. If your primary indicator suggests an entry, look for a second metric like the MACD 0.000983826 to see if it provides a conflicting story. Testing your idea against multiple data points helps filter out noise. By requiring two witnesses to agree, you reduce the chance of jumping to conclusions based on a partial view. This patient approach treats data as a puzzle where every piece must fit before the image is clear.
Probabilistic market research, not a recommendation or guaranteed return.
The comparison to keep in mind: $ETH has hourly direction down and volume above its baseline; $INIT has hourly direction down and volume above its baseline. This alone does not establish correlation.
If you treated your favorite indicator like a single witness in a detective case, what second witness would you call to verify its story?
#ASTER