📊 LUNC/USDT – Are the Bulls Weak or Just Getting Ready?
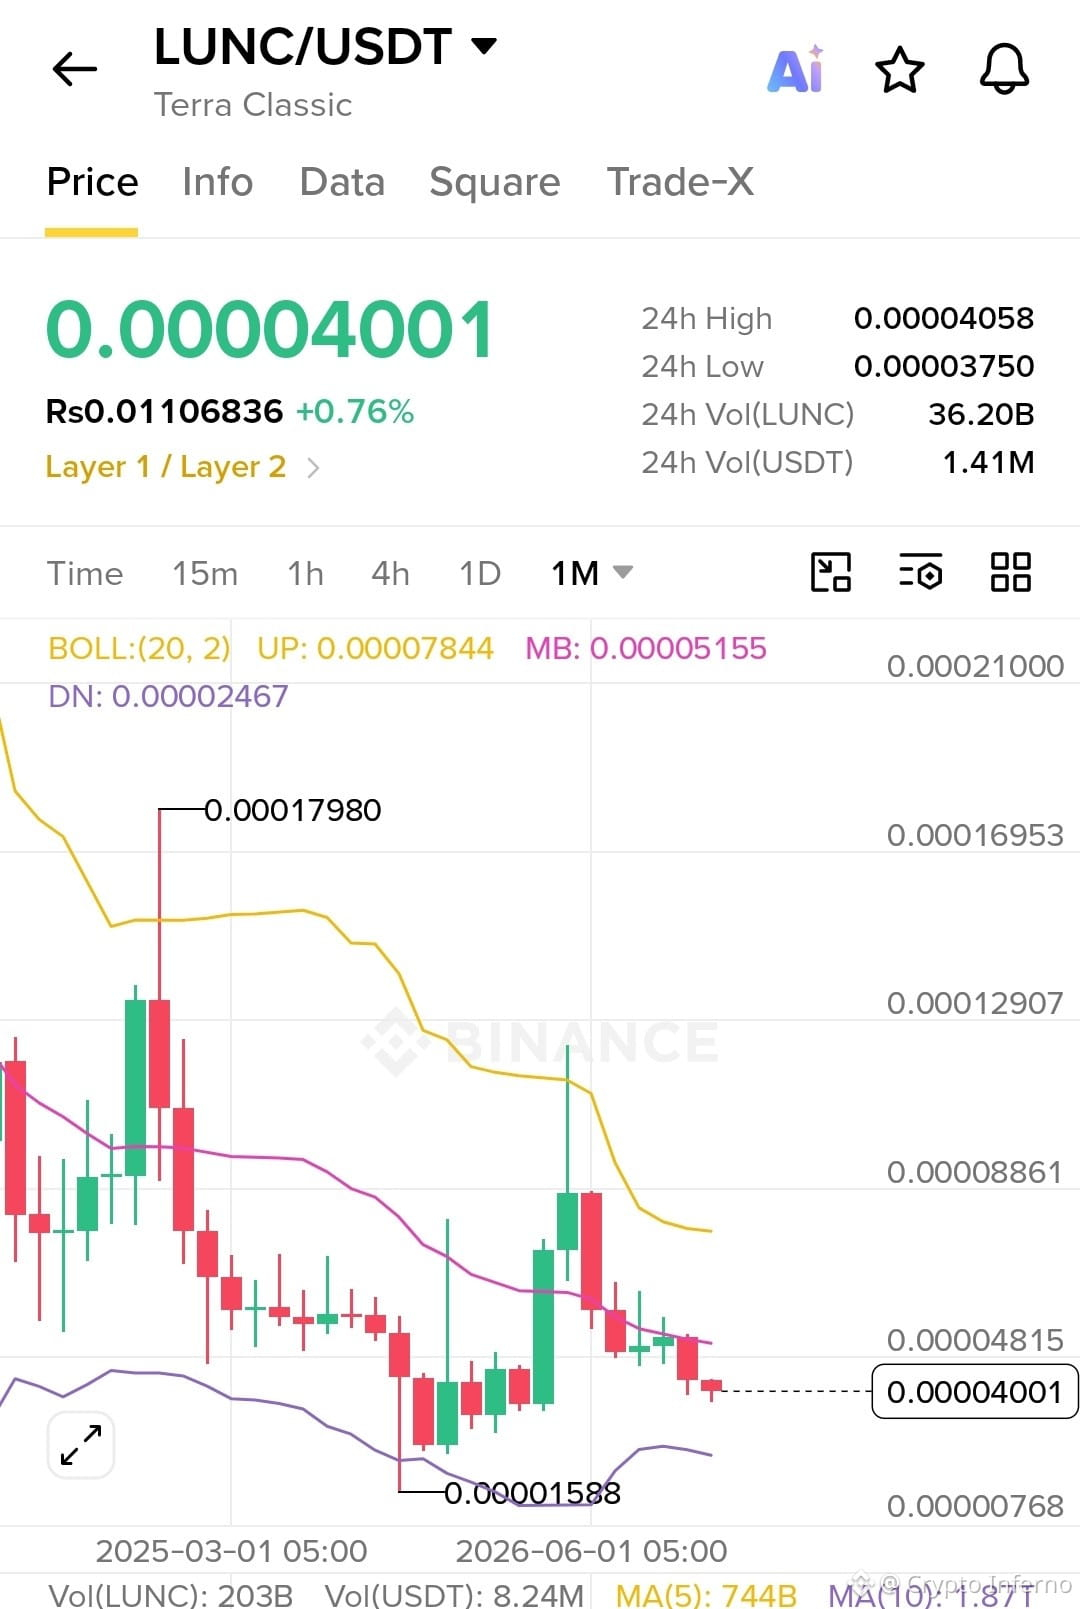
Looking at the 1-month chart, green candles are clearly fewer compared to red candles. This reflects a market that has been under selling pressure for a long time.
But here's the important question: Can a few green candles signal a strong recovery?
🟢 Fewer green candles don't automatically mean weak buying pressure. What matters is the strength of those candles, trading volume, and whether buyers can sustain upward momentum.
🔍 What the chart tells us:
The overall monthly trend remains bearish.
Selling pressure is still dominant.
Recent green candles show some buying interest.
Price is still struggling around the middle Bollinger Band (0.00005155).
The lower Bollinger Band (0.00002467) and upper band (0.00007844) show a wide trading range.
🚀 Bullish scenario: Strong green monthly candles with increasing volume and a breakout above the middle Bollinger Band could signal a trend reversal.
⚠️ Bearish scenario: If green candles remain weak and sellers continue controlling the market, LUNC could face further downside.
My takeaway: Don't judge the market by the number of green candles alone. One powerful green candle with strong volume can matter more than several weak green candles.
The real question is not how many green candles appear, but whether buyers have enough strength to change the trend.
🔥 Can LUNC surprise the market with a powerful comeback, or will the bears remain in control?
#LUNC
#TerraClassic #LUNCUSDT #CryptoAnalysis #Binance #Altcoins #CryptoMarket
Looking at the 1-month chart, green candles are clearly fewer compared to red candles. This reflects a market that has been under selling pressure for a long time.
But here's the important question: Can a few green candles signal a strong recovery?
🟢 Fewer green candles don't automatically mean weak buying pressure. What matters is the strength of those candles, trading volume, and whether buyers can sustain upward momentum.
🔍 What the chart tells us:
The overall monthly trend remains bearish.
Selling pressure is still dominant.
Recent green candles show some buying interest.
Price is still struggling around the middle Bollinger Band (0.00005155).
The lower Bollinger Band (0.00002467) and upper band (0.00007844) show a wide trading range.
🚀 Bullish scenario: Strong green monthly candles with increasing volume and a breakout above the middle Bollinger Band could signal a trend reversal.
⚠️ Bearish scenario: If green candles remain weak and sellers continue controlling the market, LUNC could face further downside.
My takeaway: Don't judge the market by the number of green candles alone. One powerful green candle with strong volume can matter more than several weak green candles.
The real question is not how many green candles appear, but whether buyers have enough strength to change the trend.
🔥 Can LUNC surprise the market with a powerful comeback, or will the bears remain in control?
#LUNC
#TerraClassic #LUNCUSDT #CryptoAnalysis #Binance #Altcoins #CryptoMarket