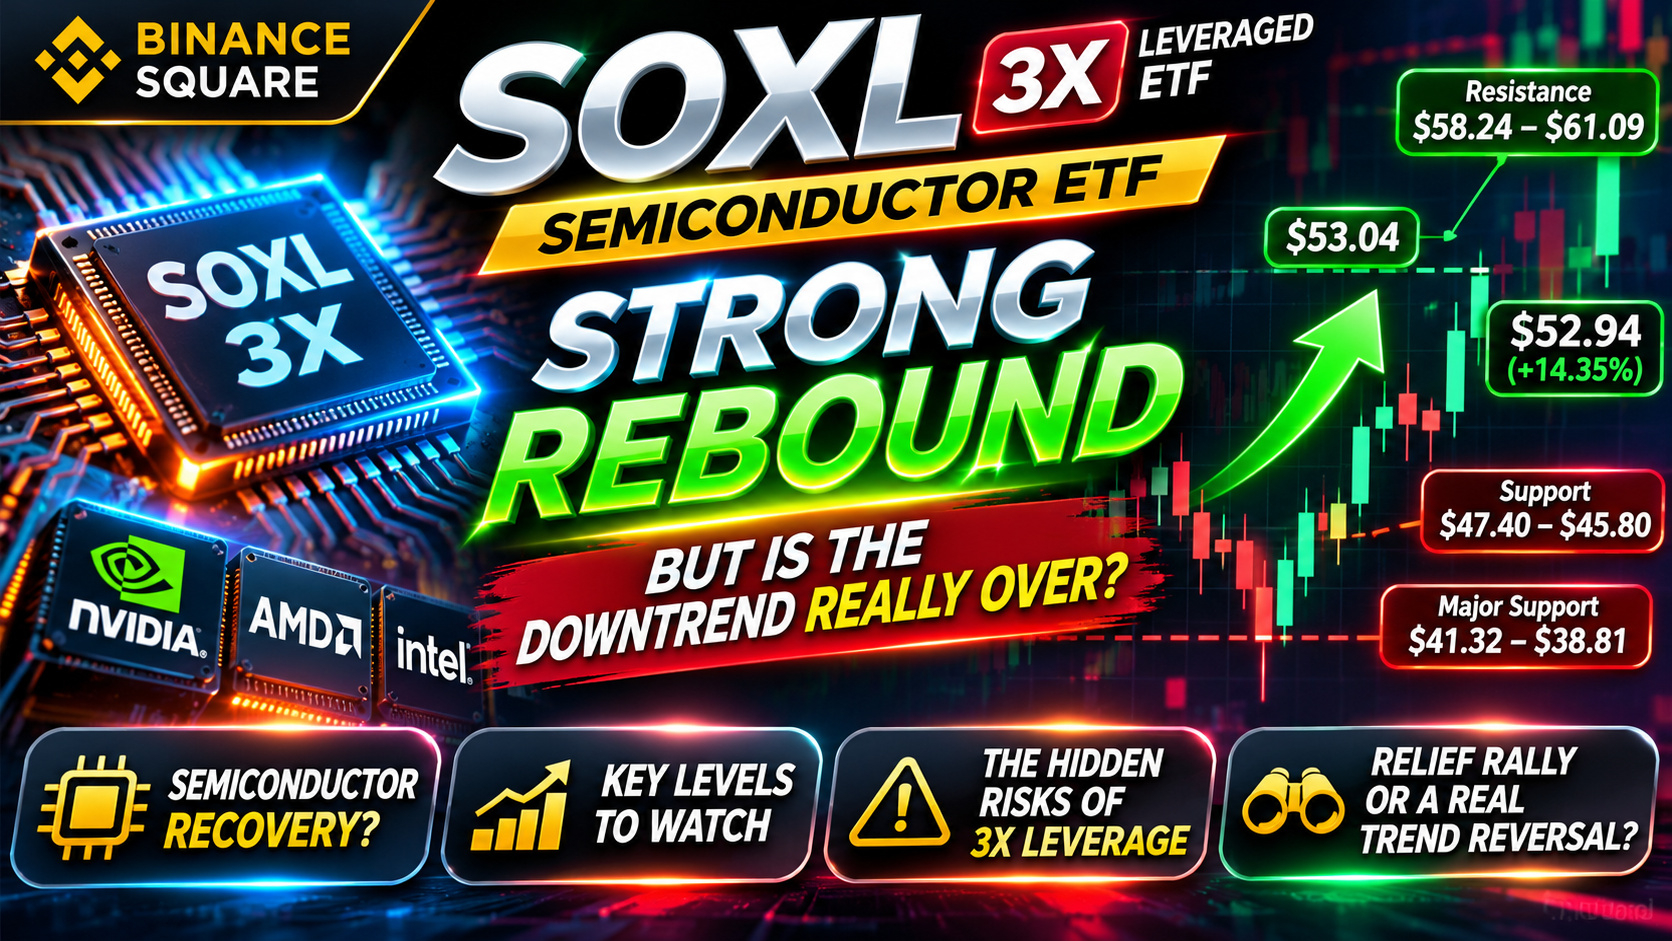
$SOXLB is showing a powerful rebound, but the bigger chart reveals a much more complicated story: buyers are returning after an aggressive semiconductor selloff, while the long-term trend remains under pressure.
According to the supplied Binance chart:
MARKET SNAPSHOT
- Price: $52.94
- 24H change: +14.35%
- 24H high: $53.04
- 24H low: $41.32
- 24H turnover: $37.88M
- 7-day performance: -31.87%
- 30-day performance: -62.08%
1. THE MULTI-TIMEFRAME CONTRADICTION
On the 1H chart, price has broken above the MA(7), MA(25) and MA(99), currently clustered around $46–47. This suggests buyers have gained short-term control.
The 4H chart also shows a strong breakout above its MA(7) at $46.21 and MA(25) at $45.84.
However, the daily chart tells a different story. Price is still below the MA(25) at $79.06 and MA(99) at $117.94. The broader structure remains bearish.
2. LEVELS THAT MATTER
Immediate resistance: $53.04, followed by $58.24 and $61.09.
First support: $47.40–$45.80.
Major downside support: $41.32, followed by the recent swing low at $38.81.
3. WHAT COMES NEXT?
Bullish scenario: A sustained breakout above $53.04 could open the way toward $58–61.
Bearish scenario: Rejection near $53 followed by a loss of $45.80 could bring sellers back toward $41.32.
THE OVERLOOKED RISK
SOXL is a 3X daily leveraged semiconductor ETF. Its returns can be heavily affected by volatility and daily compounding. A sharp rebound does not automatically mean a sustainable trend reversal.
My view: The next confirmation is whether buyers can defend the $46–47 breakout zone.
Is this the beginning of a semiconductor recovery, or simply a powerful relief rally inside a larger downtrend?
NFA. DYOR
According to the supplied Binance chart:
MARKET SNAPSHOT
- Price: $52.94
- 24H change: +14.35%
- 24H high: $53.04
- 24H low: $41.32
- 24H turnover: $37.88M
- 7-day performance: -31.87%
- 30-day performance: -62.08%
1. THE MULTI-TIMEFRAME CONTRADICTION
On the 1H chart, price has broken above the MA(7), MA(25) and MA(99), currently clustered around $46–47. This suggests buyers have gained short-term control.
The 4H chart also shows a strong breakout above its MA(7) at $46.21 and MA(25) at $45.84.
However, the daily chart tells a different story. Price is still below the MA(25) at $79.06 and MA(99) at $117.94. The broader structure remains bearish.
2. LEVELS THAT MATTER
Immediate resistance: $53.04, followed by $58.24 and $61.09.
First support: $47.40–$45.80.
Major downside support: $41.32, followed by the recent swing low at $38.81.
3. WHAT COMES NEXT?
Bullish scenario: A sustained breakout above $53.04 could open the way toward $58–61.
Bearish scenario: Rejection near $53 followed by a loss of $45.80 could bring sellers back toward $41.32.
THE OVERLOOKED RISK
SOXL is a 3X daily leveraged semiconductor ETF. Its returns can be heavily affected by volatility and daily compounding. A sharp rebound does not automatically mean a sustainable trend reversal.
My view: The next confirmation is whether buyers can defend the $46–47 breakout zone.
Is this the beginning of a semiconductor recovery, or simply a powerful relief rally inside a larger downtrend?
NFA. DYOR