🚨 Waiting for lower #Bitcoin lows? The mathematical probabilities are heavily stacked against you.
If we look back at the explosive recovery from the cycle bottom, BTC gave us a clear blueprint. After the supply in profit initially dropped below 50%, it triggered a massive 74% rally over the following months, which eventually cooled off to a supply in profit of 59.2% by March 2023 before grinding higher.
Fast forward to today, and we are witnessing an identical structural setup. As of November 8, 2026, BTCs supply in profit has settled right back into that same critical pivot zone at 58.5%.
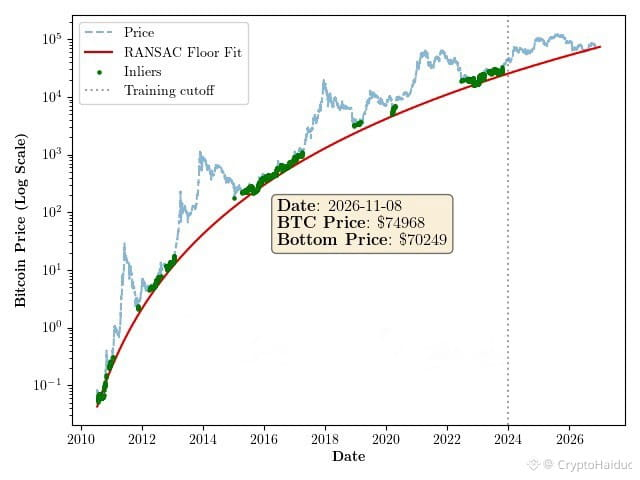
Here is the real wake-up call for the bears. Look at the RANSAC Floor Fit model, which tracks the asset's absolute historical baseline. Right now, the mathematical bottom for $BTC sits at exactly $70,249. Historically, Bitcoin spends 99% of its entire lifecycle above this red line. If you are sitting on your hands hoping for a catastrophic dip below $70K, you are literally betting your portfolio on a 1% anomaly.
At current levels, any Dollar Cost Averaging (DCA) between the $70K mathematical floor and the $73.3K Bull Market Support Band is an absolute gift. The trend is clear, and the data is staring us right in the face.
Don't let a 1% probability shake you out of a 99% setup. 🚀📈
$BTC
#BinanceSquare #BinanceSquareFamily #BinanceSquareTalks
If we look back at the explosive recovery from the cycle bottom, BTC gave us a clear blueprint. After the supply in profit initially dropped below 50%, it triggered a massive 74% rally over the following months, which eventually cooled off to a supply in profit of 59.2% by March 2023 before grinding higher.
Fast forward to today, and we are witnessing an identical structural setup. As of November 8, 2026, BTCs supply in profit has settled right back into that same critical pivot zone at 58.5%.
Here is the real wake-up call for the bears. Look at the RANSAC Floor Fit model, which tracks the asset's absolute historical baseline. Right now, the mathematical bottom for $BTC sits at exactly $70,249. Historically, Bitcoin spends 99% of its entire lifecycle above this red line. If you are sitting on your hands hoping for a catastrophic dip below $70K, you are literally betting your portfolio on a 1% anomaly.
At current levels, any Dollar Cost Averaging (DCA) between the $70K mathematical floor and the $73.3K Bull Market Support Band is an absolute gift. The trend is clear, and the data is staring us right in the face.
Don't let a 1% probability shake you out of a 99% setup. 🚀📈
$BTC
#BinanceSquare #BinanceSquareFamily #BinanceSquareTalks