
Based on your Binance screenshot, here is a detailed technical analysis of Gold (XAUUSDT) on the 4-hour (4H) timeframe.
1. Current Market Overview
Indicator
Chart information
Trading Pair
XAUUSDT
Market
Perpetual Futures
Timeframe
4 Hours
Current Price
$4,106.68
Market Open Change
+0.89%
Previous Chart High
$4,222.58
Recent Chart Low
$3,881.02
Funding Rate
0.00000%
These figures are taken from your screenshot, not independently verified live prices.
2. Price Action Analysis
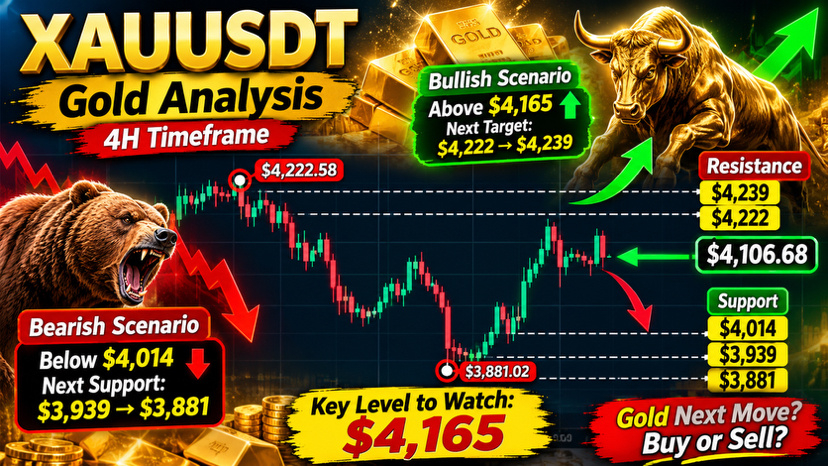
Gold previously experienced a significant decline from approximately $4,222.58 toward $3,881.02.
After reaching this low, buyers entered the market and pushed the price upward.
Three important developments are visible:
Strong recovery: Buyers pushed Gold upward from the $3,881 area.
Bullish momentum: Price recovered above the $4,014 level.
Consolidation: Gold is now trading around $4,106, showing some hesitation near resistance.
This suggests that buyers have regained some short-term strength, although a confirmed trend reversal is not yet established.
3. Important Support Levels
These are approximate technical levels based on the visible chart.
Support
Price
S1
$4,014
S2
$3,939
S3
$3,881
Support analysis:
$4,014 is the first important support.
$3,939 is the next downside area.
$3,881 is the major visible swing low.
A 4-hour candle closing below $4,014 could weaken the current recovery.
4. Important Resistance Levels
Resistance
Price
R1
$4,120–$4,165
R2
$4,222
R3
$4,239
Resistance analysis:
$4,120–$4,165 is the immediate resistance zone.
$4,222 is the previous visible high.
A convincing breakout above $4,222 could indicate stronger bullish momentum.
5. Bullish and Bearish Scenarios
Bullish scenario
Positive
If Gold breaks above $4,165 and maintains its position, the next important resistance is around $4,222.
A confirmed breakout above $4,222 could open the way toward $4,239.
Bearish scenario
Negative
If Gold fails to break resistance and falls below $4,014, the next support zones are $3,939 and $3,881.
6. Market Sentiment
My interpretation of the visible price action:
Buyers have shown strength after the recent decline.
The market has recovered significantly from its recent low.
The price is approaching an important resistance region.
A breakout confirmation is needed before calling this a strong bullish trend.
7. Important Risk Warning
Your screenshot shows 20x leverage on Binance Futures.
Leverage can magnify both profits and losses. A relatively small adverse price movement can cause substantial losses or liquidation. Avoid treating these chart levels as guaranteed predictions.
8. Final Technical Conclusion
Recovery Bias
Gold is showing a short-term recovery after a significant decline. However, the $4,120–$4,165 resistance zone is important.
Key level to watch: $4,165.
Above resistance: bullish momentum may strengthen.
Below $4,014: recovery may weaken.
Below $3,881: bearish structure becomes more concerning.
Overall: Cautiously bullish on the visible short-term price action, but confirmation is still needed.
I can also prepare a professional XAUUSDT Gold technical-analysis cover image showing the bullish and bearish scenarios, support levels, resistance levels, and price targets.