📉
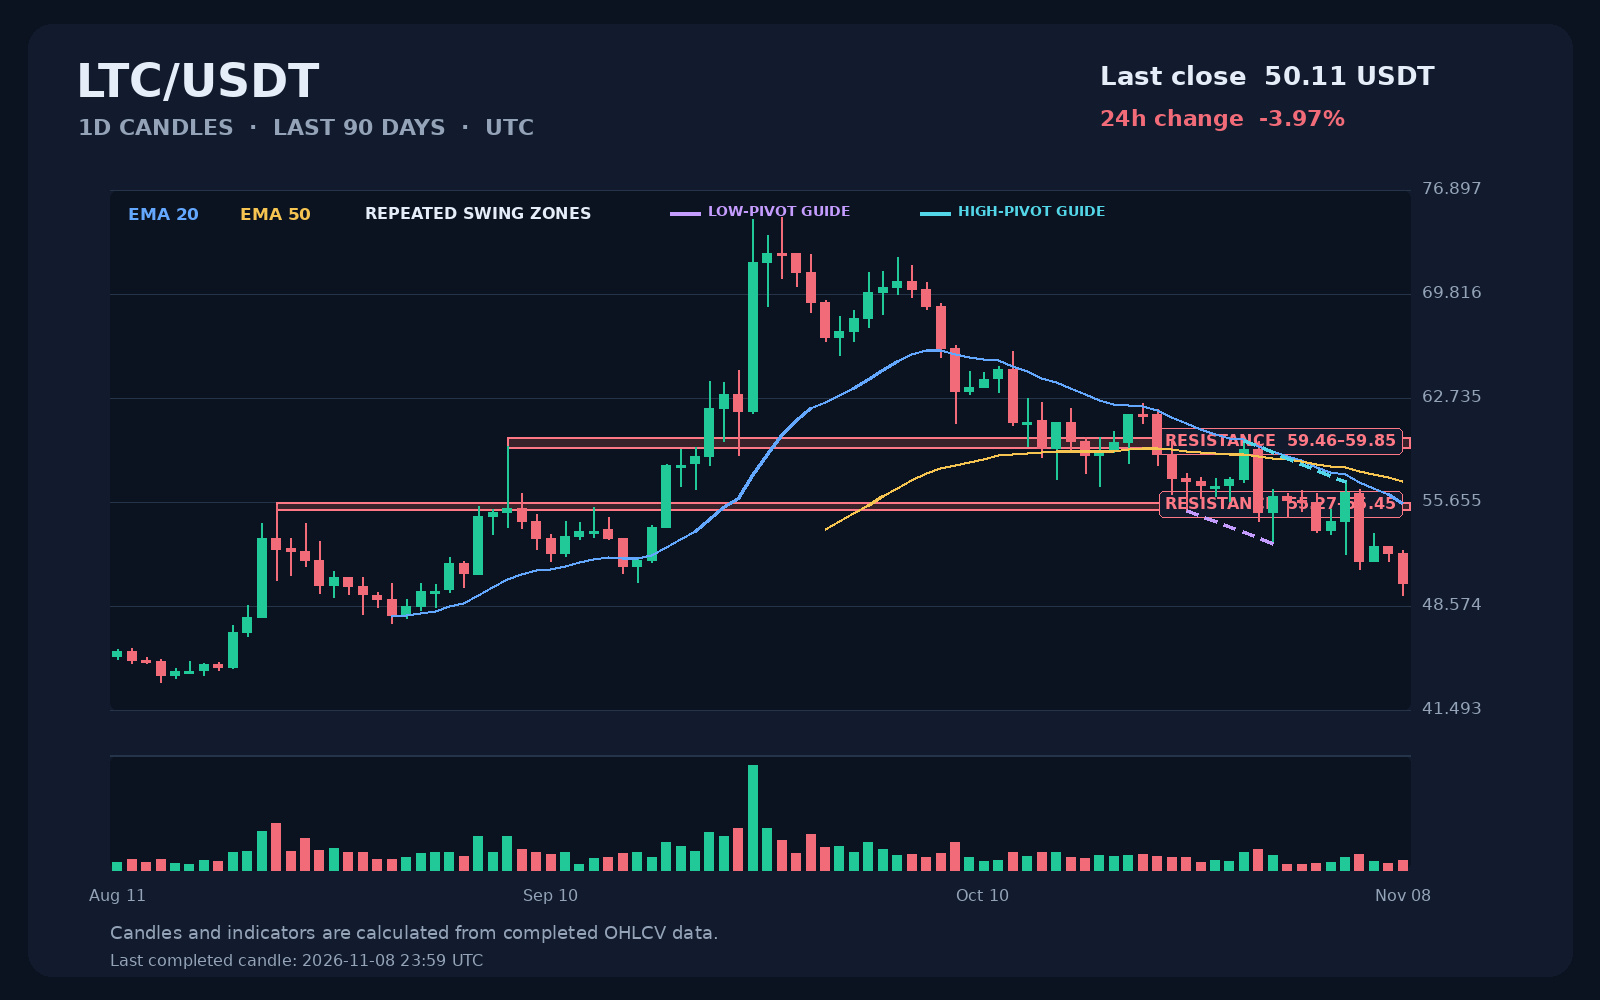
Litecoin closed November 8 at 50.11 USDT, down 3.97% for the day.
Price sits below both the 20-day EMA (55.57) and 50-day EMA (57.05), with the shorter average also below the longer one. That's a bearish technical setup.
The recent swing highs and lows are declining, and the latest close sits below both falling pivot guides. Buyers have yet to show a convincing shift in momentum.
The 55.27–55.45 zone is the first notable resistance area. A sustained recovery above it and the two EMAs would suggest selling pressure is easing. The next historical resistance zone lies at 59.46–59.85.
Until then, the 90-day low at 43.39 remains an important historical reference, not a confirmed support level.
No verified Litecoin-specific news explains this decline. With U.S. inflation data due November 10, broader market volatility is another factor worth watching.
For now,
Litecoin closed November 8 at 50.11 USDT, down 3.97% for the day.
Price sits below both the 20-day EMA (55.57) and 50-day EMA (57.05), with the shorter average also below the longer one. That's a bearish technical setup.
The recent swing highs and lows are declining, and the latest close sits below both falling pivot guides. Buyers have yet to show a convincing shift in momentum.
The 55.27–55.45 zone is the first notable resistance area. A sustained recovery above it and the two EMAs would suggest selling pressure is easing. The next historical resistance zone lies at 59.46–59.85.
Until then, the 90-day low at 43.39 remains an important historical reference, not a confirmed support level.
No verified Litecoin-specific news explains this decline. With U.S. inflation data due November 10, broader market volatility is another factor worth watching.
For now,