🚀 JCT/USDT: MASSIVE +138% MOVE! WHAT'S NEXT FOR JUNCTION?
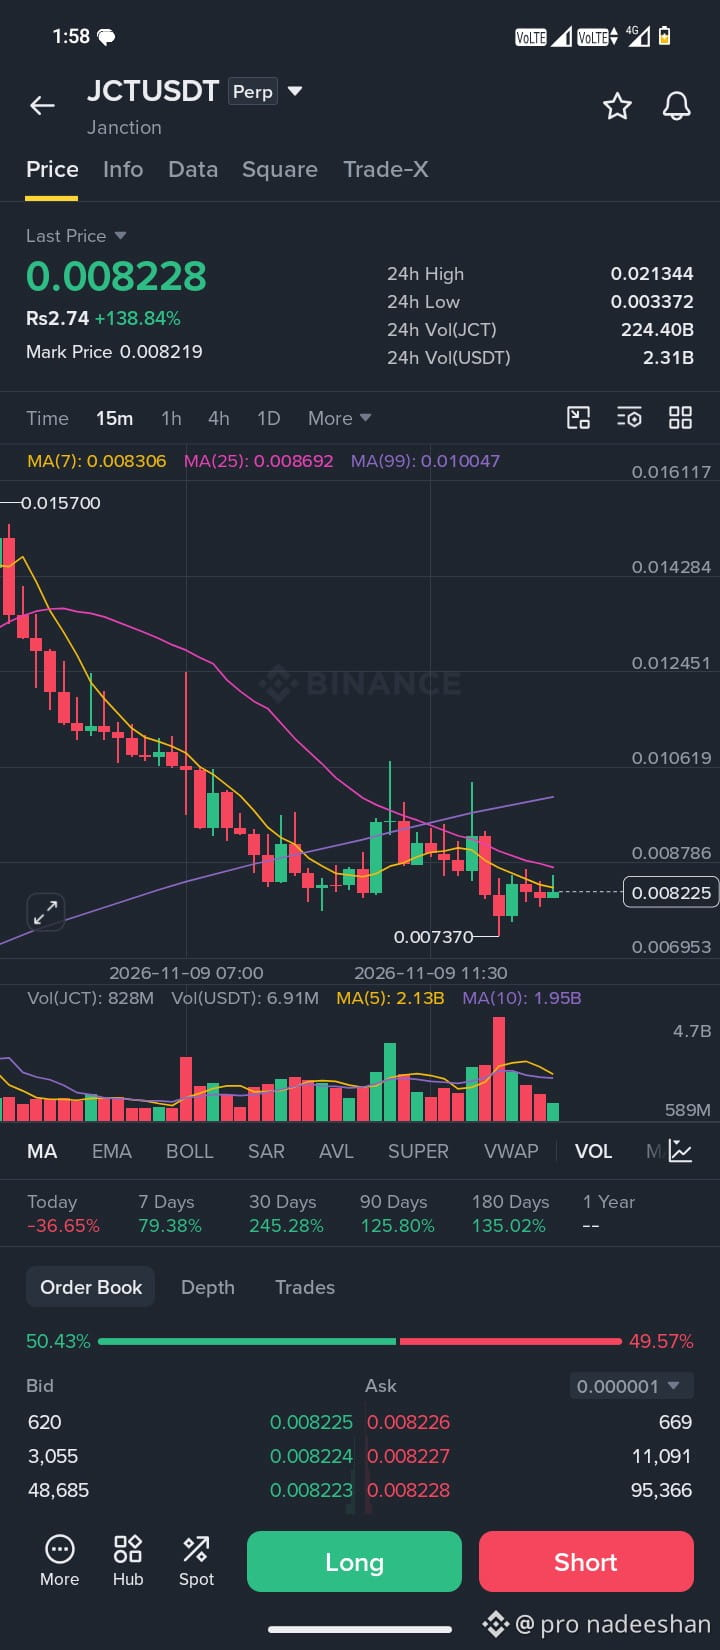
JCT has made a huge move, gaining approximately 138.84% in 24 hours, but the latest 15-minute chart shows an important battle between buyers and sellers.
📊 Technical Analysis (15M Chart)
🔹 Current Price: $0.008228
🔹 24H High: $0.021344
🔹 24H Low: $0.003372
📉 Market Structure:
After a massive rally, JCT experienced a strong correction. The price is now consolidating around the $0.0082 zone.
📈 Moving Average Analysis:
- MA(7): $0.008306
- MA(25): $0.008692
- MA(99): $0.010047
The price is currently below all three moving averages, indicating that short-term bearish pressure is still present.
🎯 Important Price Levels:
🟢 Support Zone:
- $0.007370
- $0.007000
🔴 Resistance Zone:
- $0.008700
- $0.010000
🔥 What Should Traders Watch?
If buyers manage to push the price above $0.0087 with strong volume, a potential recovery could develop toward $0.0100.
However, if the $0.00737 support breaks, further downside pressure may follow.
💡 My Observation:
JCT is showing signs of consolidation after a massive move. The next breakout could be important, but confirmation through volume and price action is essential.
⚠️ Don't chase green candles. Always manage your risk and do your own research.
What do you think? Is JCT preparing for another bullish move, or will sellers take control?
👇 Share your thoughts in the comments!
#JCT #JCTUSDT #CryptoAnalysis #BinanceSquare #CryptoTrading #Altcoins #TechnicalAnalysis #CryptoMarket #Bitcoin$JCT #
JCT has made a huge move, gaining approximately 138.84% in 24 hours, but the latest 15-minute chart shows an important battle between buyers and sellers.
📊 Technical Analysis (15M Chart)
🔹 Current Price: $0.008228
🔹 24H High: $0.021344
🔹 24H Low: $0.003372
📉 Market Structure:
After a massive rally, JCT experienced a strong correction. The price is now consolidating around the $0.0082 zone.
📈 Moving Average Analysis:
- MA(7): $0.008306
- MA(25): $0.008692
- MA(99): $0.010047
The price is currently below all three moving averages, indicating that short-term bearish pressure is still present.
🎯 Important Price Levels:
🟢 Support Zone:
- $0.007370
- $0.007000
🔴 Resistance Zone:
- $0.008700
- $0.010000
🔥 What Should Traders Watch?
If buyers manage to push the price above $0.0087 with strong volume, a potential recovery could develop toward $0.0100.
However, if the $0.00737 support breaks, further downside pressure may follow.
💡 My Observation:
JCT is showing signs of consolidation after a massive move. The next breakout could be important, but confirmation through volume and price action is essential.
⚠️ Don't chase green candles. Always manage your risk and do your own research.
What do you think? Is JCT preparing for another bullish move, or will sellers take control?
👇 Share your thoughts in the comments!
#JCT #JCTUSDT #CryptoAnalysis #BinanceSquare #CryptoTrading #Altcoins #TechnicalAnalysis #CryptoMarket #Bitcoin$JCT #