
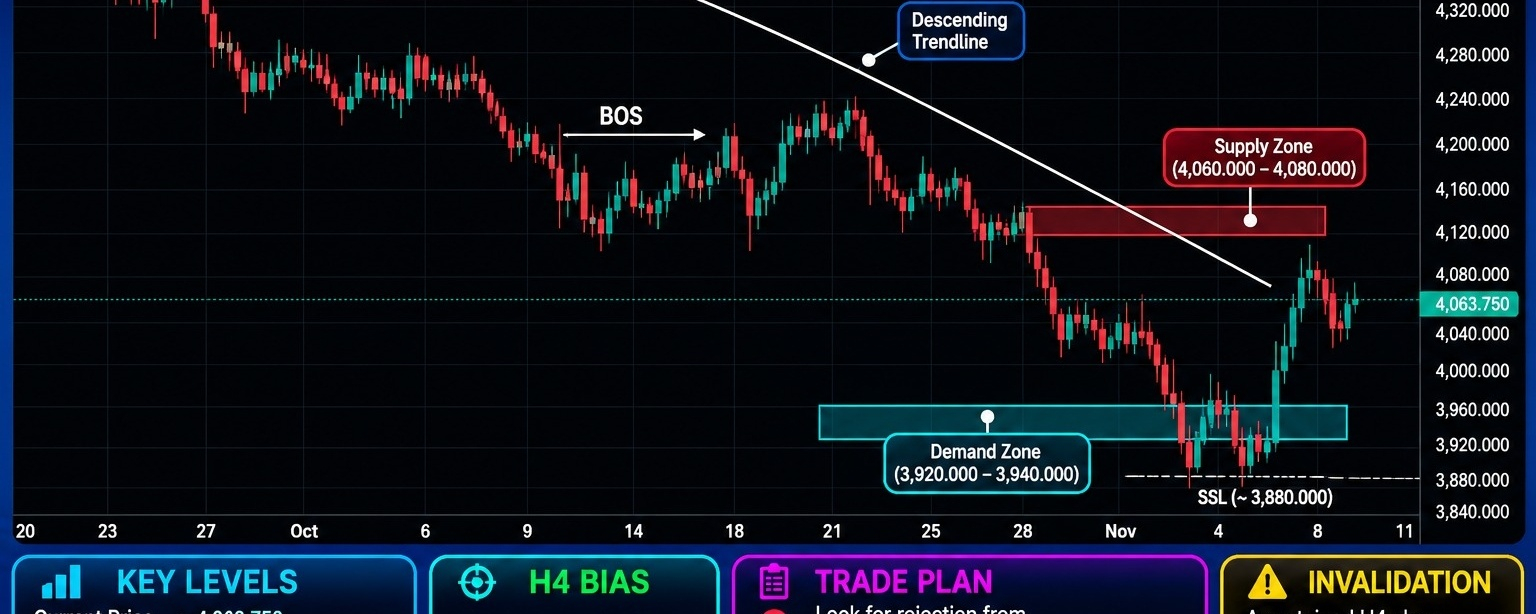

H4 Bias: Bearish
Structure State: Extended bearish market structure with lower highs and lower lows, a descending trendline, and a recent corrective recovery from the 3,920.000–3,940.000 demand region.
Market Structure
$XAU developed a sustained bearish structure following rejection from the 4,320.000–4,340.000 major supply region. The market subsequently established a sequence of lower highs and lower lows, accompanied by repeated downside displacement.
A bearish break of structure developed during the decline, confirming the loss of the earlier bullish momentum. Price continued trading beneath the descending trendline before reaching the 3,920.000–3,940.000 demand region.
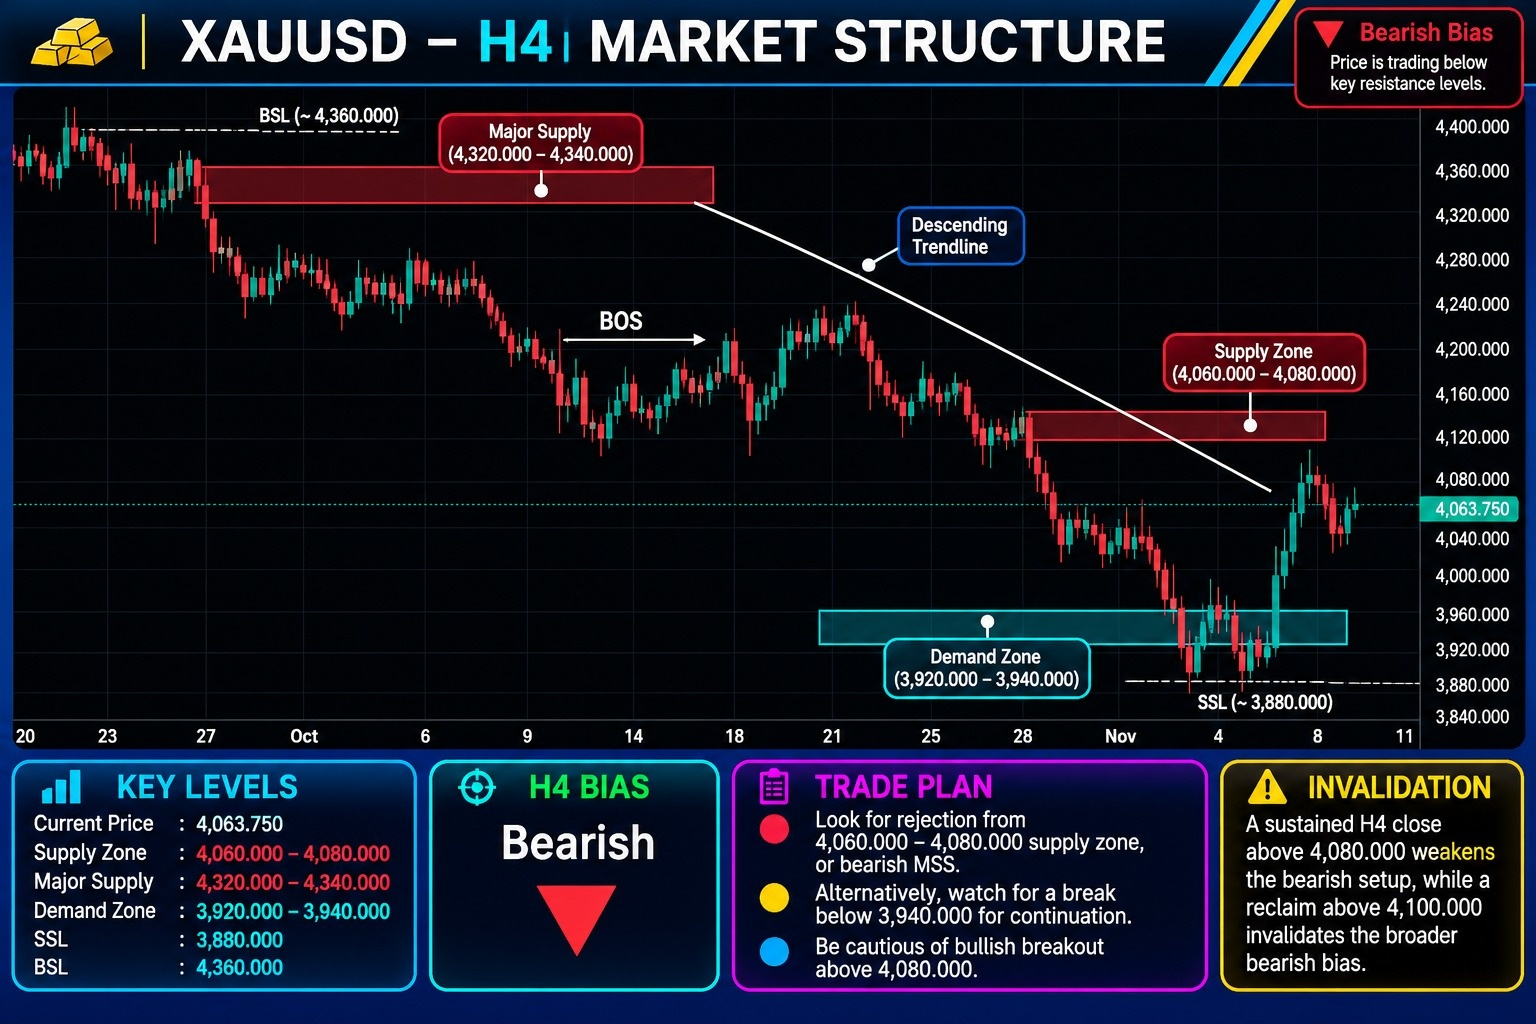
A reaction from this demand region produced a bullish recovery toward the current price of 4,063.750. However, the recovery has approached the 4,060.000–4,080.000 supply region, where sellers may attempt to defend the broader bearish structure.
The current upward movement should therefore be treated as a corrective retracement unless price establishes sustained bullish acceptance above the relevant supply and trendline resistance.
Key Resistance
Supply Zone: 4,060.000–4,080.000 — immediate supply and bearish reaction region.
Major Supply: 4,320.000–4,340.000 — higher-timeframe bearish supply and order-block region.
Buy-side Liquidity: Approximately 4,360.000.
Key Support
Demand Zone: 3,920.000–3,940.000 — major demand and recent bullish reaction region.
Sell-side Liquidity: Approximately 3,880.000.
Immediate structural reference: 4,000.000.
FVG — Fair Value Gap
No specific FVG boundaries are explicitly identified in the supplied chart. The technical assessment therefore relies on the confirmed visible structure, supply, demand, and trendline rather than introducing unverified imbalance levels.
Order Block (OB)
The 4,320.000–4,340.000 region represents the major supply and bearish order-block area. The 4,060.000–4,080.000 region is the nearer-term supply zone where sellers may attempt to resume the downside movement.
The 3,920.000–3,940.000 region represents the principal demand zone and recent bullish reaction area.
Liquidity Map
Buy-side liquidity (BSL): Approximately 4,360.000.
Sell-side liquidity (SSL): Approximately 3,880.000.
Immediate supply: 4,060.000–4,080.000.
Major demand: 3,920.000–3,940.000.
Trade Scenarios
Bearish continuation: Rejection from 4,060.000–4,080.000, accompanied by bearish displacement or MSS, would support another downside move toward 4,000.000 and the 3,940.000 demand boundary. A confirmed breakdown below 3,940.000 would expose the 3,880.000 sell-side liquidity region.
Bullish recovery: A sustained reclaim above 4,080.000 would weaken the immediate bearish setup. However, a broader bullish reversal would require stronger acceptance above the descending trendline and subsequent recovery toward the 4,100.000 region.
Trendline
A clearly defined descending trendline connects the major lower highs and confirms the prevailing bearish structure. The latest bullish recovery is approaching this overhead resistance structure, making the 4,060.000–4,080.000 region particularly important.
Invalidation
A sustained H4 close above 4,080.000 weakens the immediate bearish setup. A sustained reclaim above 4,100.000 invalidates the broader bearish bias according to the chart's outlined conditions.
Professional Summary
Primary bias: Bearish.
Immediate supply: 4,060.000–4,080.000.
Major supply: 4,320.000–4,340.000.
Buy-side liquidity: Approximately 4,360.000.
Major demand: 3,920.000–3,940.000.
Sell-side liquidity: Approximately 3,880.000.
Bearish trigger: Rejection from 4,060.000–4,080.000 with bearish displacement/MSS.
Recovery trigger: Sustained reclaim above 4,080.000, with stronger confirmation above 4,100.000.
Risk consideration: Gold has experienced a notable recovery from demand. The immediate supply zone and descending trendline are critical resistance references. Avoid assuming bearish continuation without evidence of renewed selling pressure.