

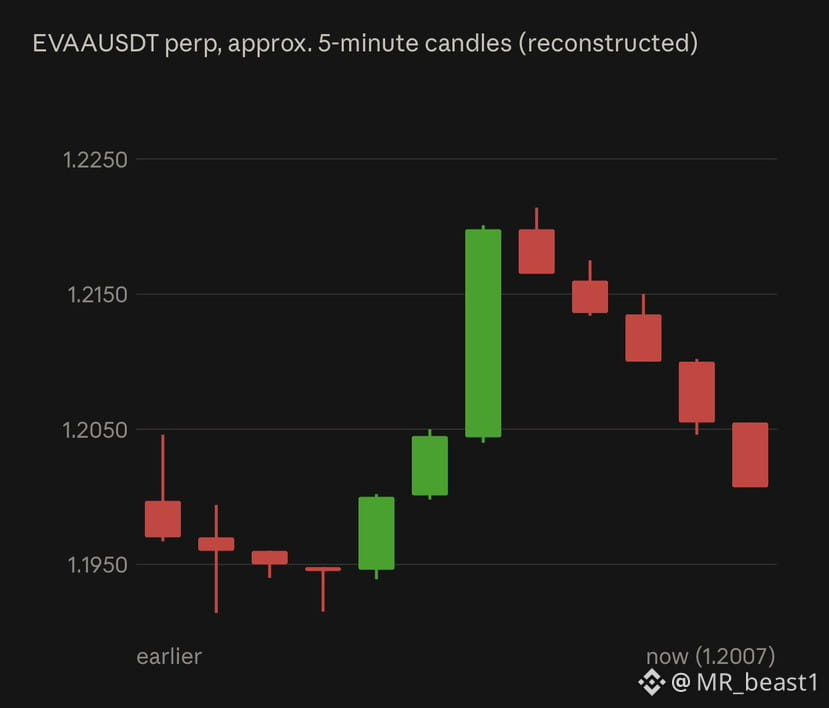
$EVAA is trading at 1.2007 USDT with a mark price of 1.2010. It is down 11.35% over 24h (-9.82% “Today”), with a range of 1.1890–1.4424 and about 23.27M USDT (17.70M EVAA) in volume. That is about 25% below the 1.6077 in your previous EVAA screenshot, and a bit below the 1.2883 in the first one. Returns are mixed: -6.57% over 7 days and -53.57% over 1 year, but +80.12% over 30 days, +38.84% over 90 days and +96.32% over 180 days. In the visible window, price built a base around 1.1914–1.1960, rallied sharply to a peak near 1.2214, and then slid steadily back to the current level. It is just below the MA60 (1.2039), which is sloping down, so the short-term trend still favors sellers. The order book is nearly balanced (52.50% bids vs 47.50% asks). Support is near 1.1914, then the 24h low of 1.1890, and resistance is at the MA60 (1.2039), then 1.2214 and the 24h high of 1.4424. A close back above the MA60 would be the first sign of stabilizing, while a break below 1.1890 would set a new 24h low. Swings of this size on a leveraged perp can liquidate positions quickly.
厳選トピックで世界の暗号資産トレーダーの仲間入り
⚡️ 暗号資産に関する最新かつ有益な情報が見つかります。
💬 世界最大の暗号資産取引所から信頼されています。
👍 認証を受けたクリエイターから、有益なインサイトを得られます。
メール / 電話番号