
$SOLV A Recovery Structure Is Emerging After a Prolonged Decline
Long Setup
Entry Zone: 0.00435 – 0.00448
Stop Loss: 0.00385
TP1: 0.0047105
TP2: 0.0051705
TP3: 0.0056305
Market Analysis:
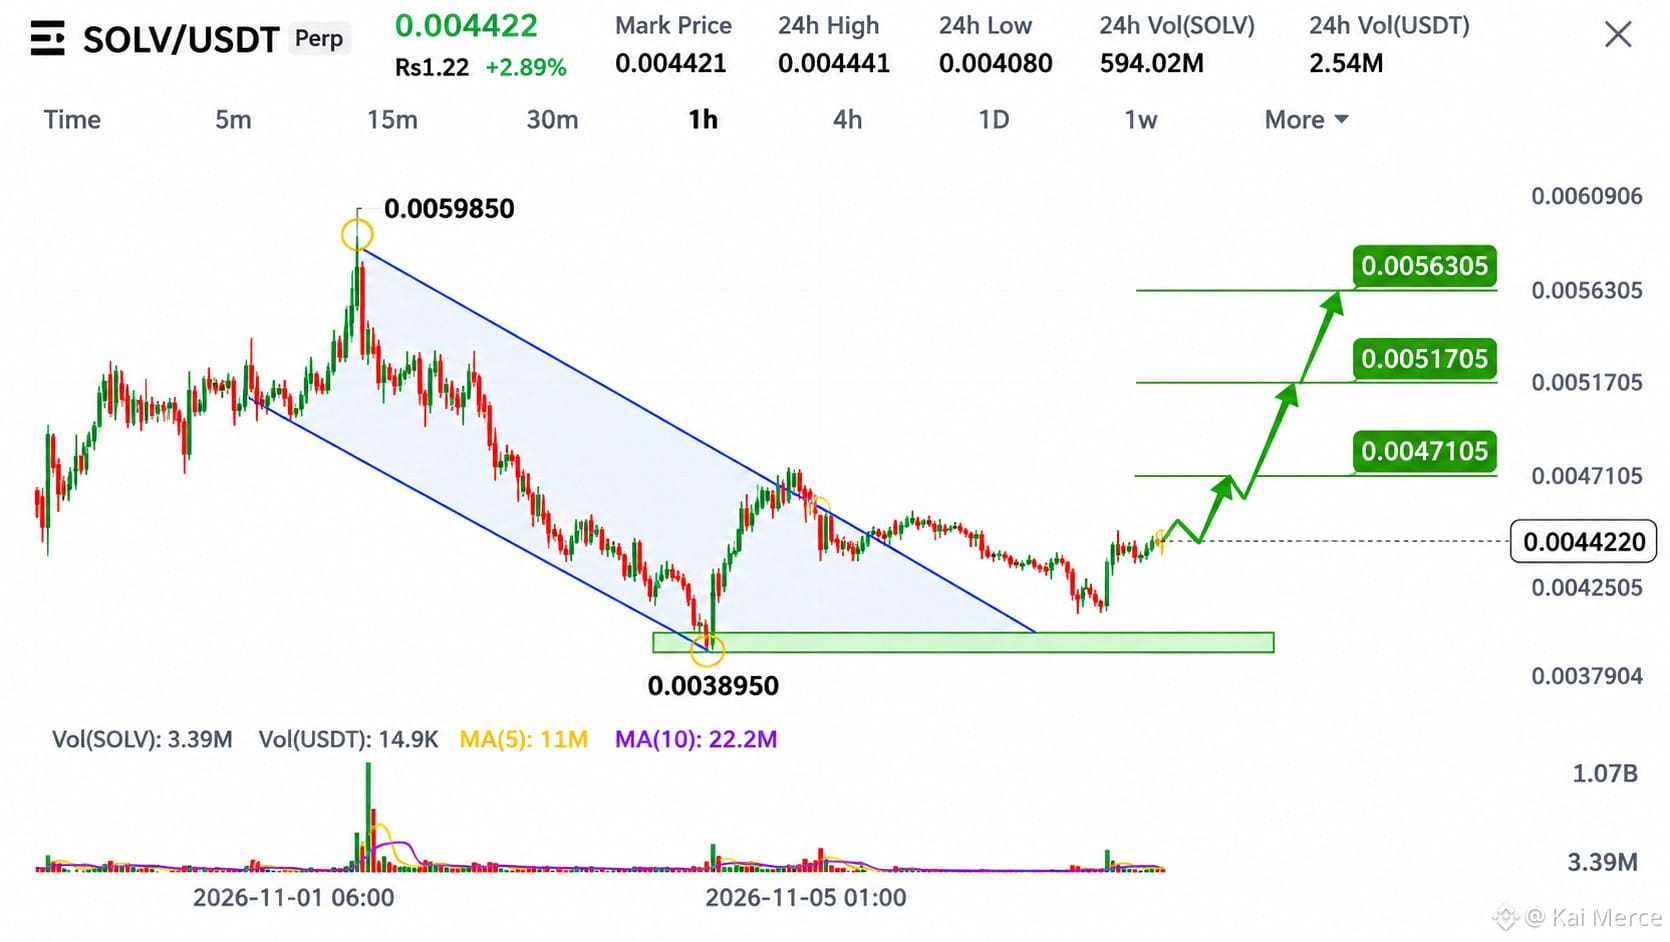
SOLV is showing early signs of a potential bullish recovery on the 1H chart. After falling from its previous peak of 0.0059850, price spent considerable time inside a descending channel, creating consistent lower highs and lower lows.
However, the recent reaction around 0.0038950 is attracting attention. Buyers defended this demand area and pushed the price back toward 0.0044220, suggesting that selling pressure may be gradually weakening.
One important development is the improvement in short-term price structure. SOLV has started recovering from its recent lows and is attempting to move beyond the descending channel resistance.
The first major upside objective is 0.0047105. A successful breakout and sustained move above this level could open the way toward 0.0051705. If bullish momentum continues, the next extended target stands at 0.0056305.
Key Levels to Watch:
- Current Price: 0.0044220
- Major Support: 0.0038950
- First Resistance: 0.0047105
- Second Resistance: 0.0051705
- Major Target: 0.0056305
Confirmation: A strong 1H candle close above descending resistance, supported by increasing volume.
Invalidation: A breakdown below 0.0038950 would significantly weaken the bullish recovery setup.
SOLV is approaching an important technical transition. The recovery looks promising, but confirmation from buyers is essential before expecting a larger upward move.
Trade with discipline, avoid chasing sudden candles, and manage risk carefully.
Long Setup
Entry Zone: 0.00435 – 0.00448
Stop Loss: 0.00385
TP1: 0.0047105
TP2: 0.0051705
TP3: 0.0056305
Market Analysis:
SOLV is showing early signs of a potential bullish recovery on the 1H chart. After falling from its previous peak of 0.0059850, price spent considerable time inside a descending channel, creating consistent lower highs and lower lows.
However, the recent reaction around 0.0038950 is attracting attention. Buyers defended this demand area and pushed the price back toward 0.0044220, suggesting that selling pressure may be gradually weakening.
One important development is the improvement in short-term price structure. SOLV has started recovering from its recent lows and is attempting to move beyond the descending channel resistance.
The first major upside objective is 0.0047105. A successful breakout and sustained move above this level could open the way toward 0.0051705. If bullish momentum continues, the next extended target stands at 0.0056305.
Key Levels to Watch:
- Current Price: 0.0044220
- Major Support: 0.0038950
- First Resistance: 0.0047105
- Second Resistance: 0.0051705
- Major Target: 0.0056305
Confirmation: A strong 1H candle close above descending resistance, supported by increasing volume.
Invalidation: A breakdown below 0.0038950 would significantly weaken the bullish recovery setup.
SOLV is approaching an important technical transition. The recovery looks promising, but confirmation from buyers is essential before expecting a larger upward move.
Trade with discipline, avoid chasing sudden candles, and manage risk carefully.