$SKYAI USDT — Bulls Are Taking Control! 🚀
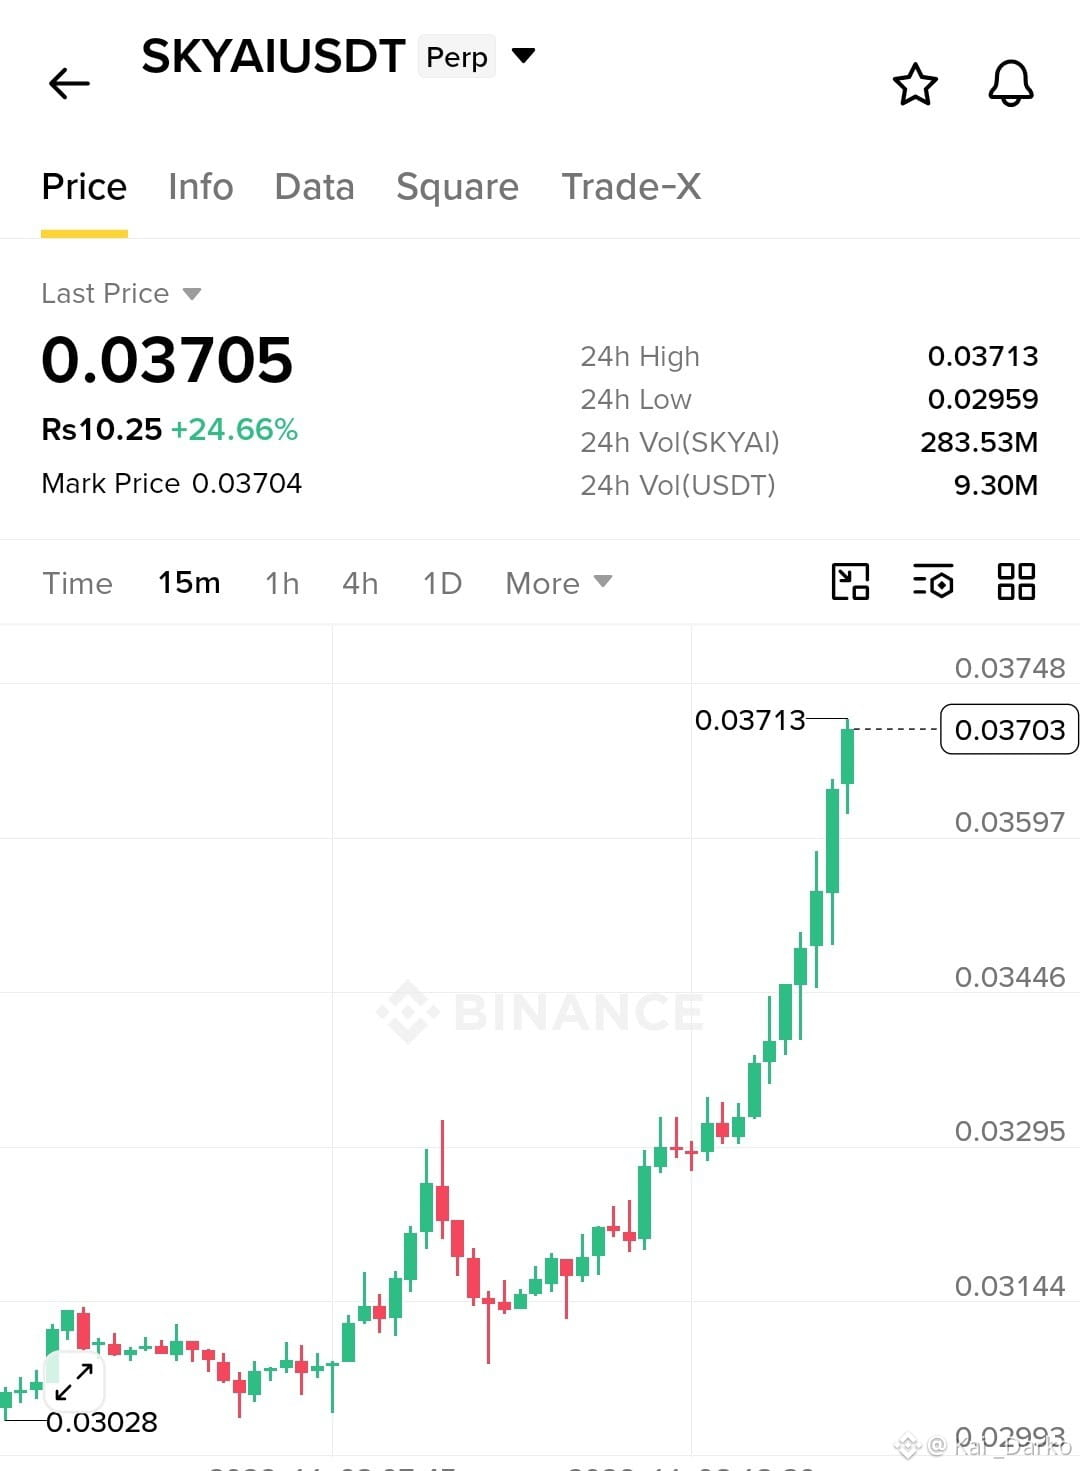
$SKYAI USDT is showing impressive bullish momentum, trading around $0.03705, up 24.66% in 24 hours. The 15-minute chart shows a strong recovery from the $0.03028 area, followed by a series of higher highs and higher lows. Buyers are clearly in control, but price is now approaching resistance near the 24H high of $0.03713.
Support & Resistance: The first support zone is $0.03597, followed by $0.03446. Holding these levels could keep the bullish structure intact. Immediate resistance stands at $0.03713, with $0.03748 as the next visible upside level.
My Trading Plan 🎯
Entry Zone: $0.03590–$0.03610 on a confirmed pullback.
Stop Loss: $0.03420, below the nearby support structure.
TP1: $0.03713 TP2: $0.03748 TP3: $0.03800 (conditional breakout extension)
Technical Outlook: The strong candle expansion and higher-high structure support bullish momentum. However, chasing after such a sharp rally carries risk. EMA, RSI, MACD and Fibonacci readings are not visible, so their confirmation cannot be assumed.
Next Move: A clean 15-minute breakout above $0.03713 could open the door toward higher levels. Failure to hold $0.03597 may trigger a deeper pullback toward $0.03446.
I would rather buy a confirmed retest than chase green candles. Keep position size controlled and protect your capital.
Are you expecting another breakout or a healthy pullback first? 👀
$SKYAI USDT is showing impressive bullish momentum, trading around $0.03705, up 24.66% in 24 hours. The 15-minute chart shows a strong recovery from the $0.03028 area, followed by a series of higher highs and higher lows. Buyers are clearly in control, but price is now approaching resistance near the 24H high of $0.03713.
Support & Resistance: The first support zone is $0.03597, followed by $0.03446. Holding these levels could keep the bullish structure intact. Immediate resistance stands at $0.03713, with $0.03748 as the next visible upside level.
My Trading Plan 🎯
Entry Zone: $0.03590–$0.03610 on a confirmed pullback.
Stop Loss: $0.03420, below the nearby support structure.
TP1: $0.03713 TP2: $0.03748 TP3: $0.03800 (conditional breakout extension)
Technical Outlook: The strong candle expansion and higher-high structure support bullish momentum. However, chasing after such a sharp rally carries risk. EMA, RSI, MACD and Fibonacci readings are not visible, so their confirmation cannot be assumed.
Next Move: A clean 15-minute breakout above $0.03713 could open the door toward higher levels. Failure to hold $0.03597 may trigger a deeper pullback toward $0.03446.
I would rather buy a confirmed retest than chase green candles. Keep position size controlled and protect your capital.
Are you expecting another breakout or a healthy pullback first? 👀