
Are you going to take short now?
HOT is showing an impressive bullish breakout! 🚀
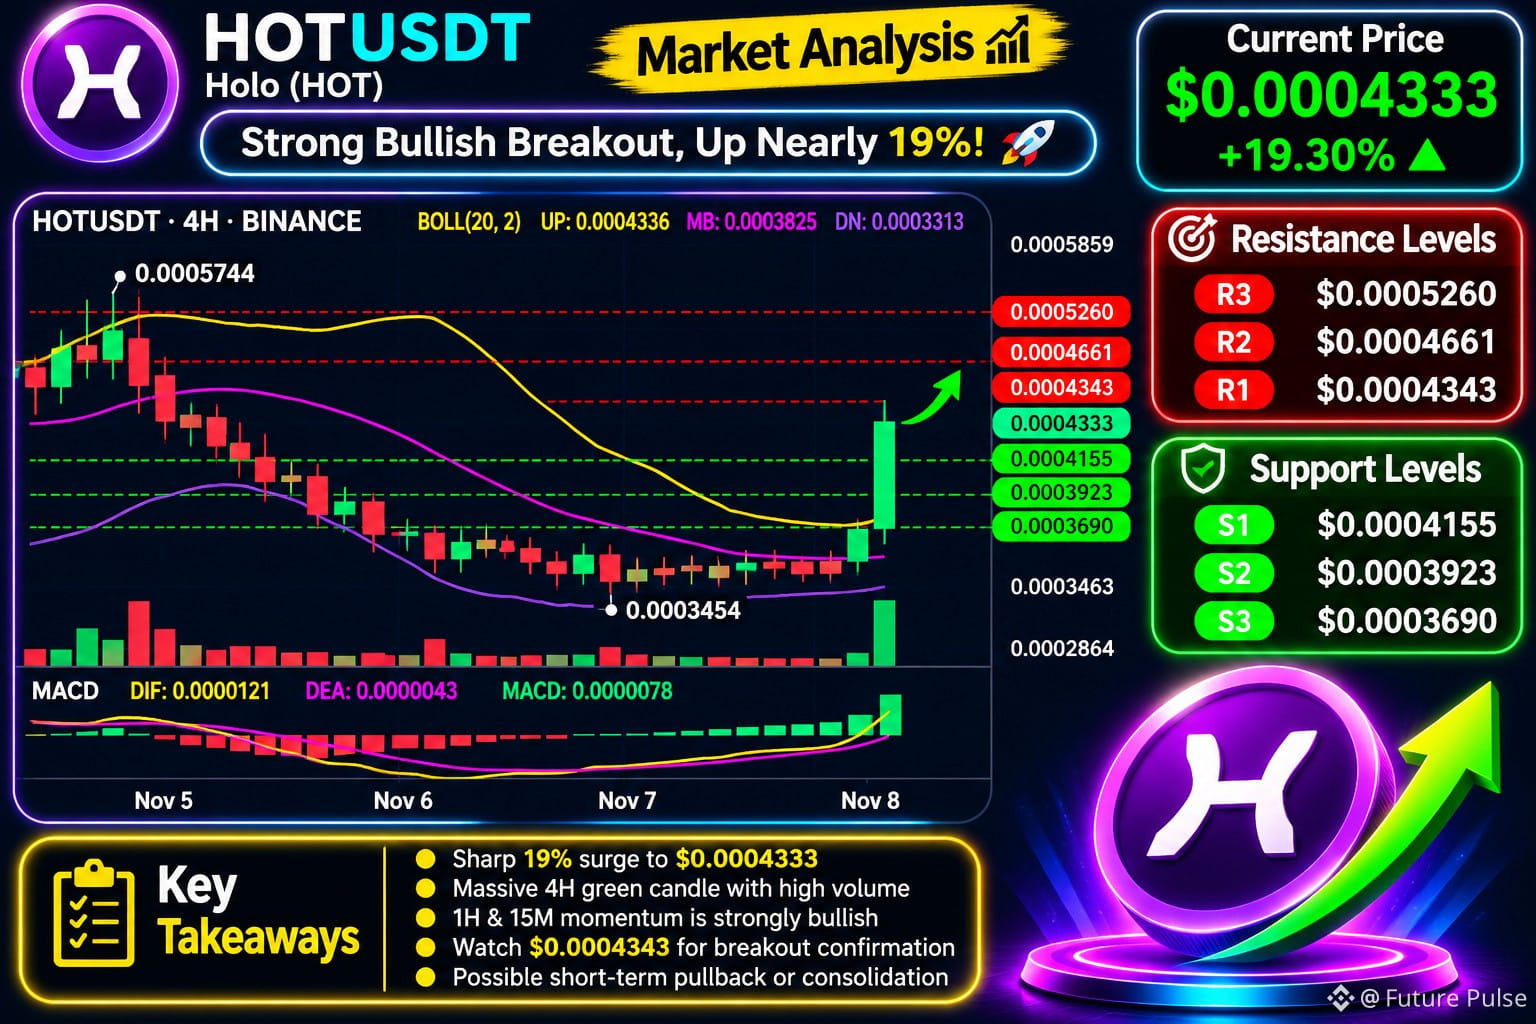
After spending time in a prolonged downtrend, HOT has surged nearly 19%, reaching $0.0004333. The 4H chart shows a massive green candle backed by a sharp increase in trading volume. Both 1H and 15M momentum indicators are strongly bullish, with MACD turning positive.
However, price is now testing the upper Bollinger Band, so a short-term pullback or consolidation wouldn't be surprising. A confirmed breakout above $0.0004343 could open the door to further upside.
🟢 Support:
$0.0004155
$0.0003923
$0.0003690
🔴 Resistance:
$0.0004343
$0.0004661
$0.0005260
Watch volume confirmation before chasing this rally.
$HOT
$BMT
$HMSTR
HOT is showing an impressive bullish breakout! 🚀
After spending time in a prolonged downtrend, HOT has surged nearly 19%, reaching $0.0004333. The 4H chart shows a massive green candle backed by a sharp increase in trading volume. Both 1H and 15M momentum indicators are strongly bullish, with MACD turning positive.
However, price is now testing the upper Bollinger Band, so a short-term pullback or consolidation wouldn't be surprising. A confirmed breakout above $0.0004343 could open the door to further upside.
🟢 Support:
$0.0004155
$0.0003923
$0.0003690
🔴 Resistance:
$0.0004343
$0.0004661
$0.0005260
Watch volume confirmation before chasing this rally.
$HOT
$BMT
$HMSTR