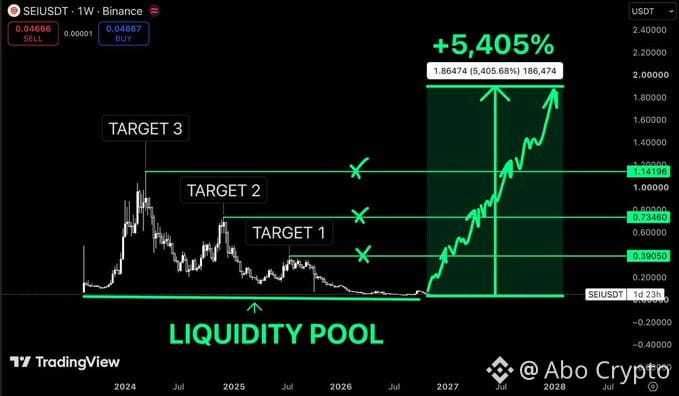
$SEI is trading at $0.046
and the chart looks completely forgotten
From above 1$ to almost zero
Two years of selling. Failed recoveries. Barely any excitement left
But here's what interests me
Price is sitting near its historical lows, right where the weekly chart is starting to flatten out
Could this be another accumulation phase?
Possibly. But I need to see buyers prove it
$0.39 is my first major target, followed by $0.73 and $1.14
If everything lines up, $1.90 becomes the extreme bull case
That's over 5,400% potential upside on this chart
The risk? This base could break, and $SEI could keep falling
Everyone loves imagining a 50x
Very few people enjoy the uncertainty that comes before a real reversa
and the chart looks completely forgotten
From above 1$ to almost zero
Two years of selling. Failed recoveries. Barely any excitement left
But here's what interests me
Price is sitting near its historical lows, right where the weekly chart is starting to flatten out
Could this be another accumulation phase?
Possibly. But I need to see buyers prove it
$0.39 is my first major target, followed by $0.73 and $1.14
If everything lines up, $1.90 becomes the extreme bull case
That's over 5,400% potential upside on this chart
The risk? This base could break, and $SEI could keep falling
Everyone loves imagining a 50x
Very few people enjoy the uncertainty that comes before a real reversa