🔴 $WLD SHORT — 4h bearish stack points lower, price below both EMAs, targeting 0.3026923 (-8.0%)
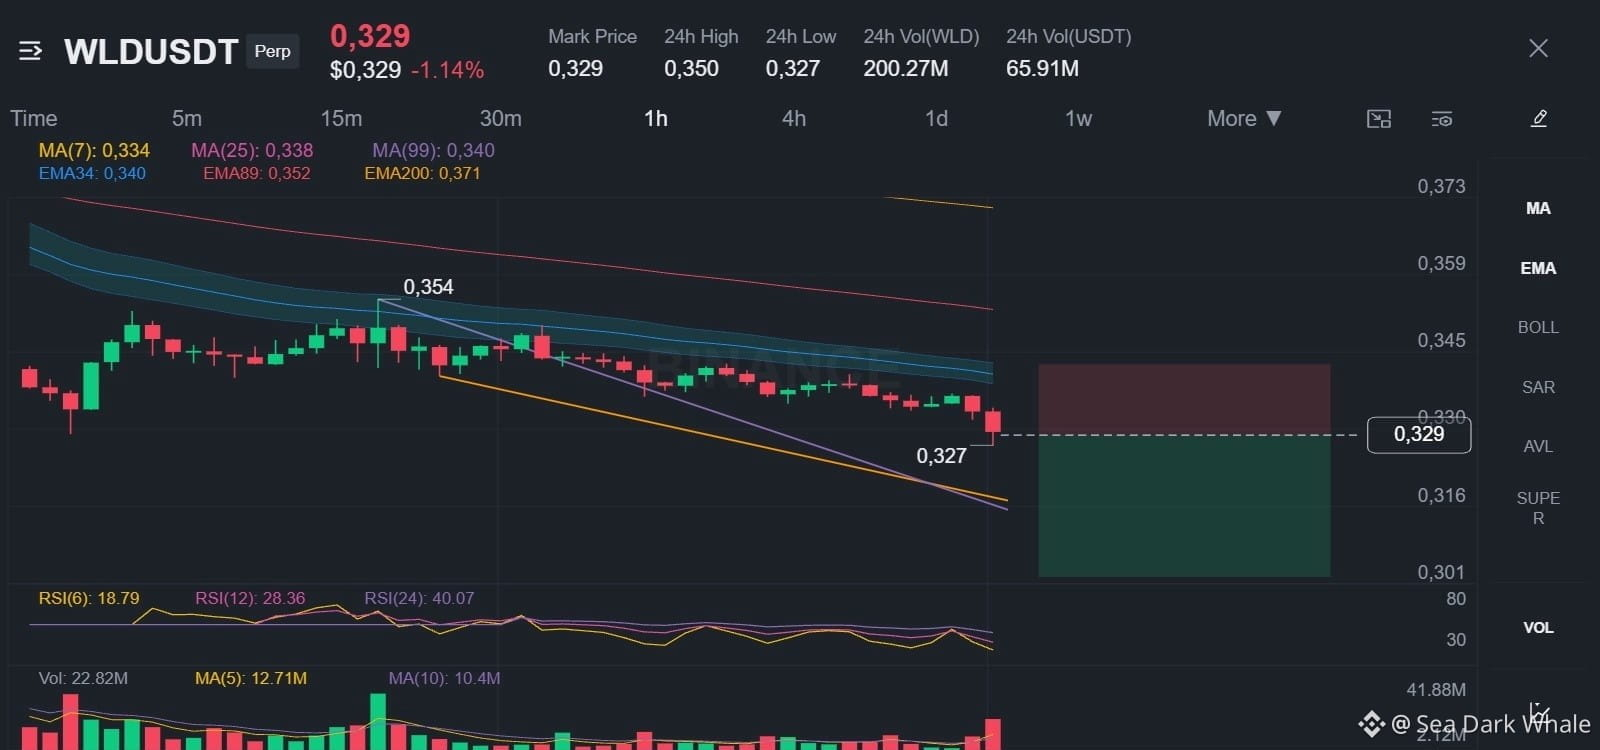
WLD is sitting below both EMAs in a bearish stack on the 4h chart, so the trend points lower. Price is at 0.329 on the perp chart, down 1.14%, with a mark price of 0.329, a 24h high of 0.350, a 24h low of 0.327, and 24h volume of 200.27M WLD (65.91M USDT). The signal chart shows 0.3297000, down 4.46% in 24h.
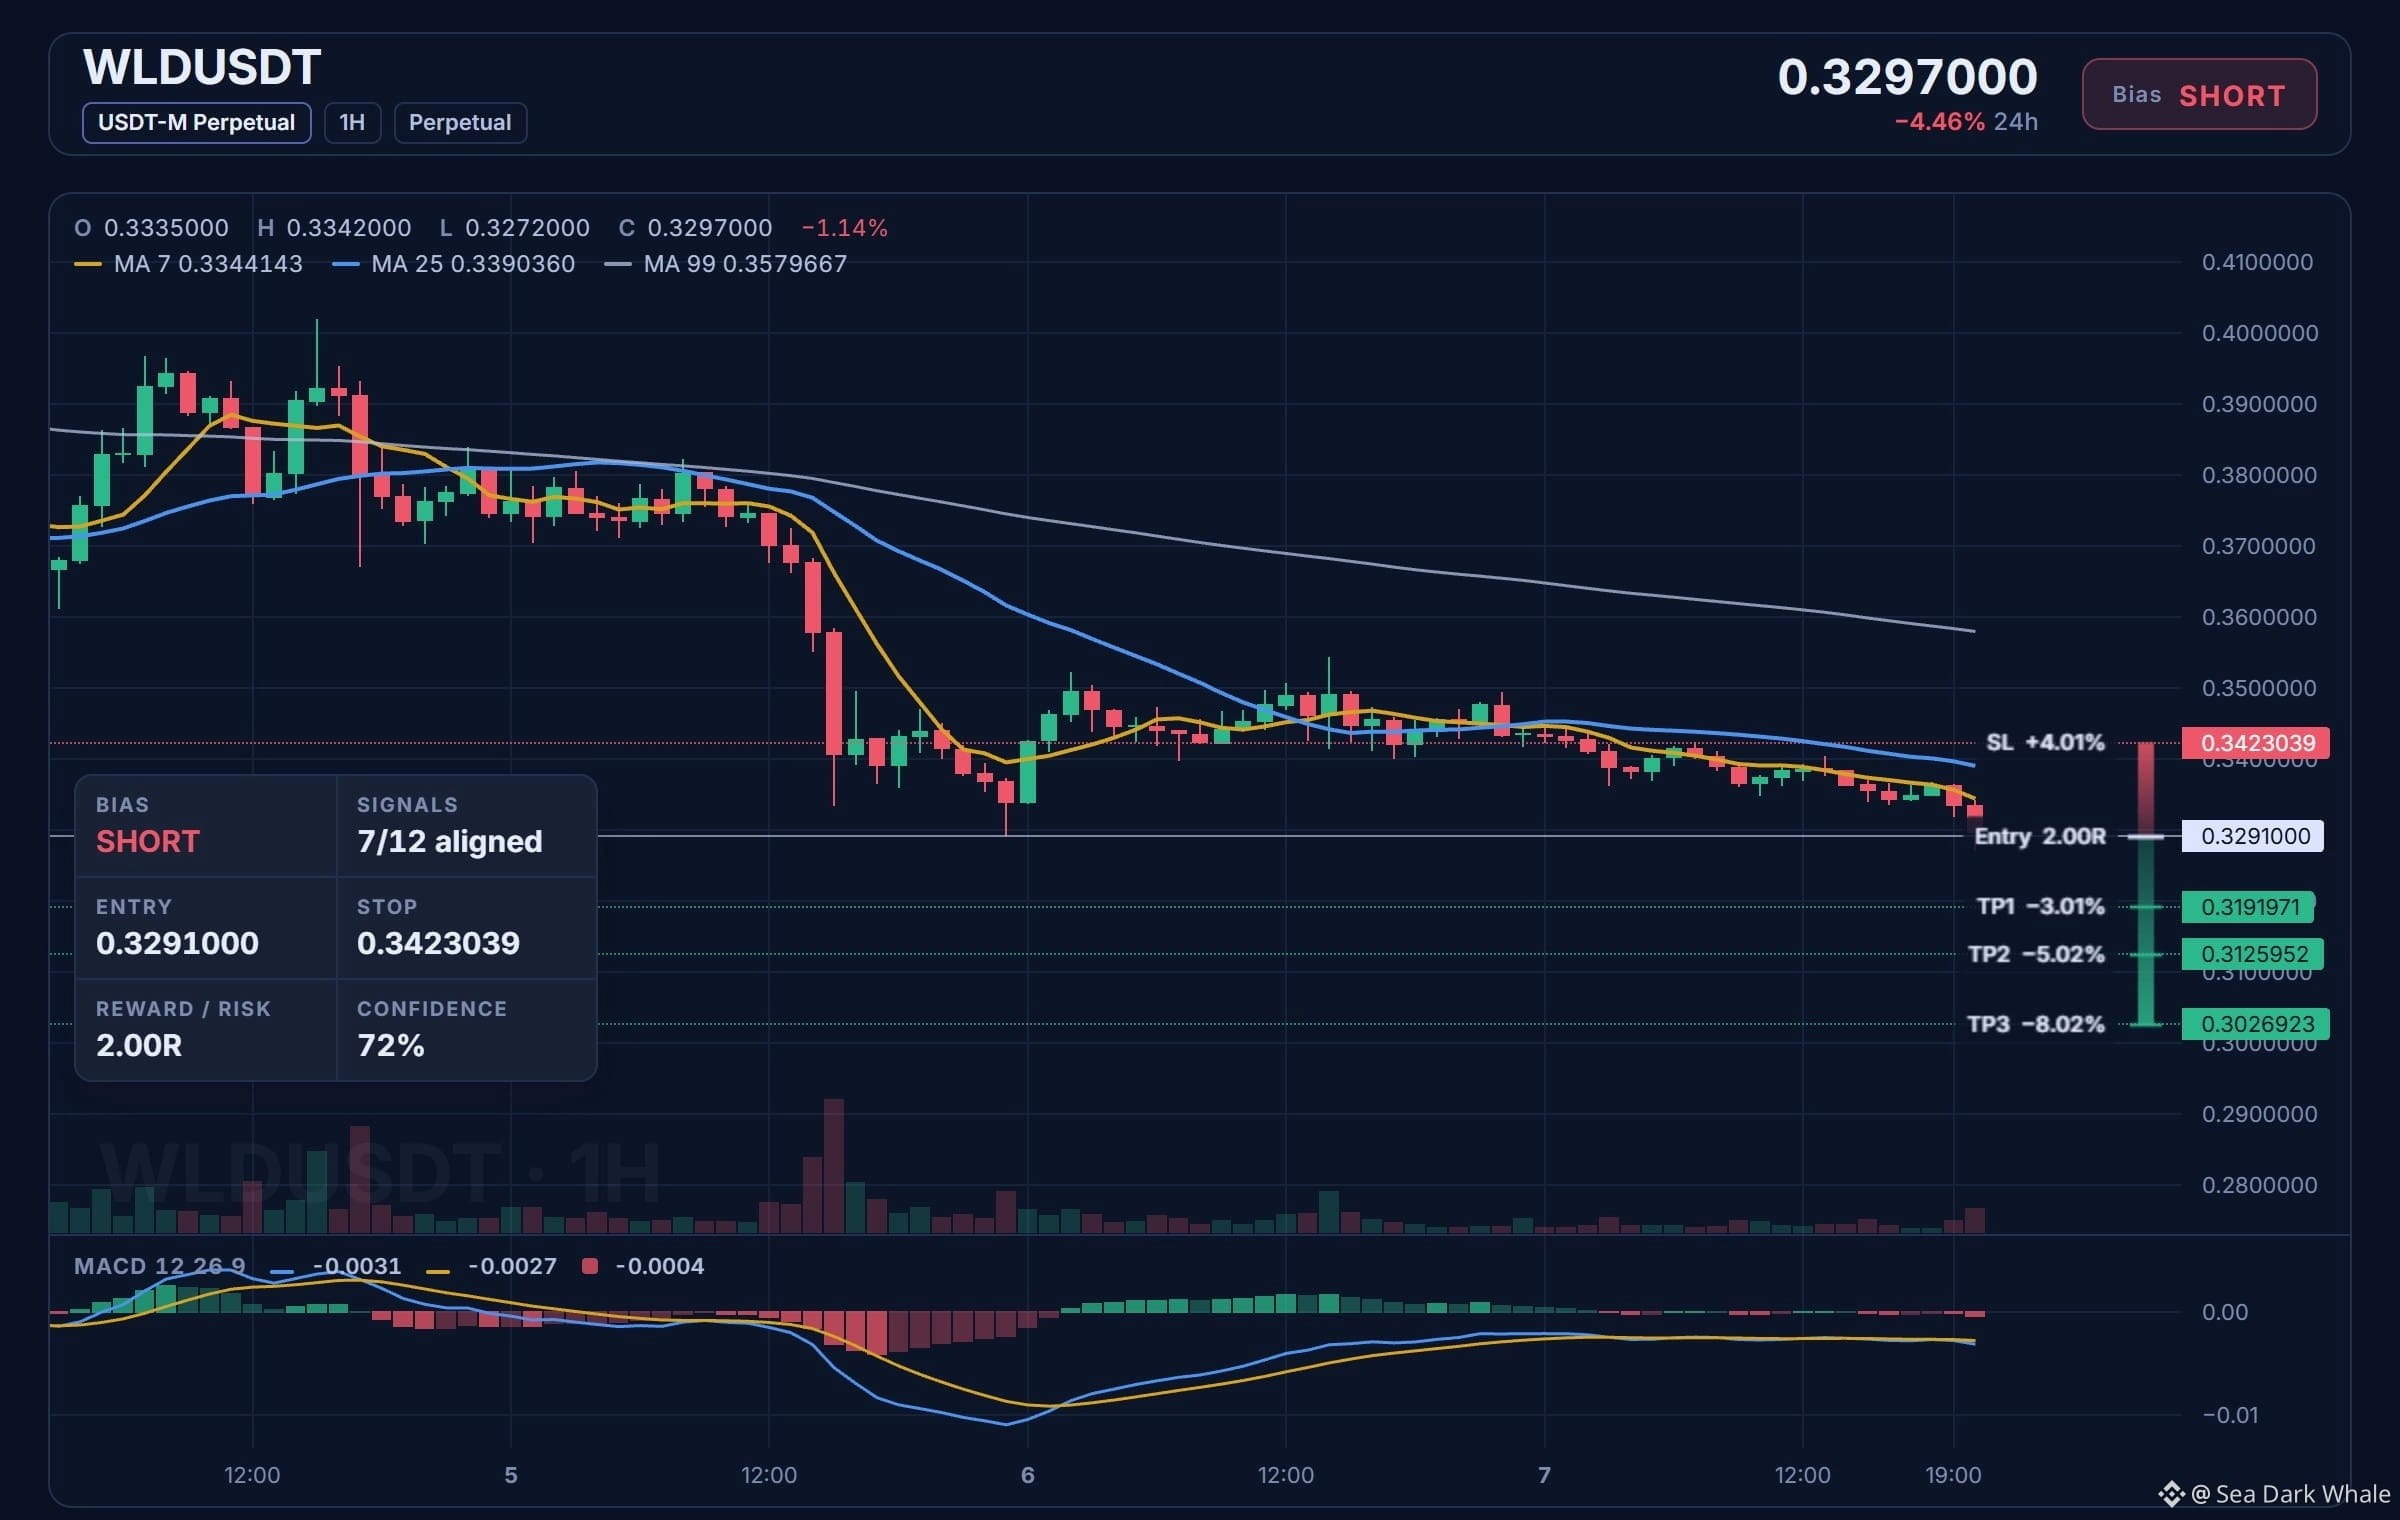
SHORT setup: 72% confidence, 7 of 12 signals aligned, up to 2.00R reward-to-risk.
Entry: 0.3286765 – 0.3295235
TP1: 0.3191971 (-3.0%)
TP2: 0.3125952 (-5.0%)
TP3: 0.3026923 (-8.0%)
SL: 0.3423039 (+4.0%)
Last 1H candle: O 0.3335000, H 0.3342000, L 0.3272000, C 0.3297000 (-1.14%). Perp chart: MA(7) 0.334, MA(25) 0.338, MA(99) 0.340; EMA34 0.340, EMA89 0.352, EMA200 0.371. Signal chart: MA 7 0.3344143, MA 25 0.3390360, MA 99 0.3579667. RSI(6) 18.79, RSI(12) 28.36, RSI(24) 40.07. MACD 12 26 9: -0.0031, -0.0027, -0.0004. Volume 22.82M, MA(5) 12.71M, MA(10) 10.4M. Charts are 1H candles, as of 7 Nov 2026, 20:00 UTC. Trade plan panel: stop 0.3423039 (+4.01%), entry 0.3291000, TP1 0.3191971 (-3.01%), TP2 0.3125952 (-5.02%), TP3 0.3026923 (-8.02%).
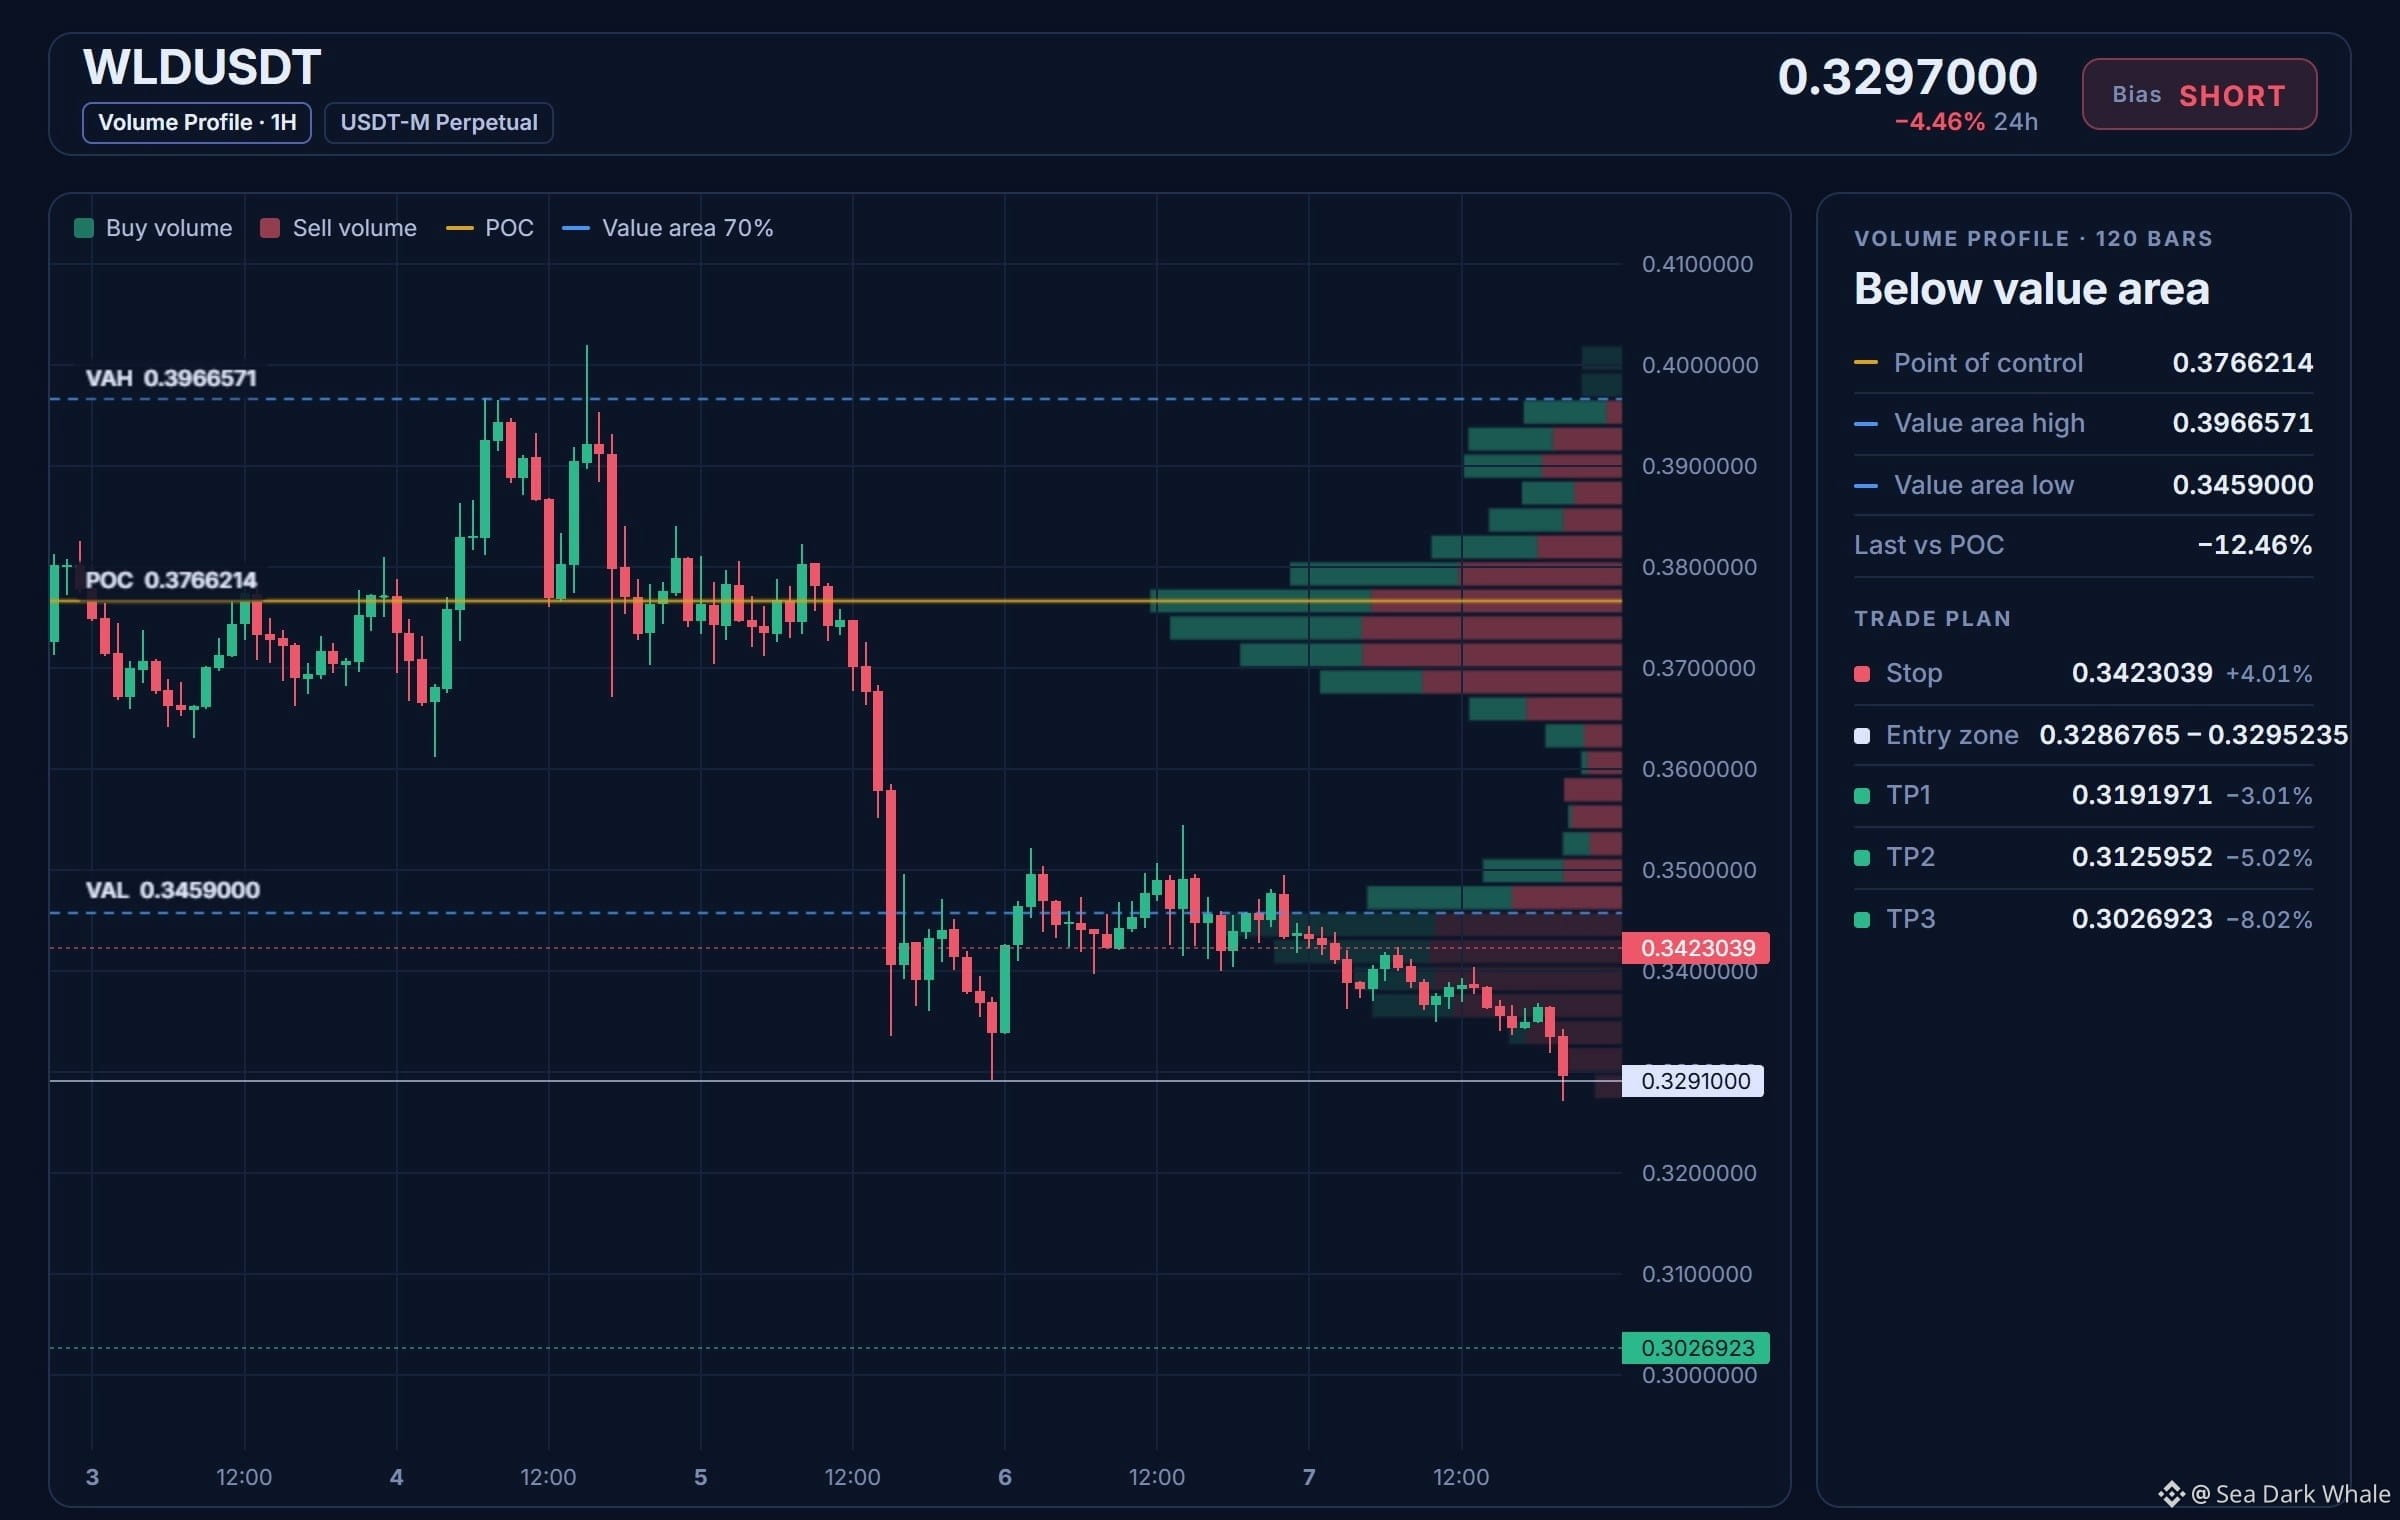
Volume profile (120 bars): price is below the value area. Point of control 0.3766214, value area high 0.3966571, value area low 0.3459000; last price is 12.46% below the point of control.
Why: the 4h trend shows price below EMA50 and EMA200 in a bearish stack, meaning the swing trend is down.
Risk: price is far below its average, so a bounce is likely (-4.1 ATR from the 1h EMA50).
Plan: close 50% at TP1, 25% at TP2, 25% at TP3, and move the stop to entry after TP1.
Do you see this as a good short entry?
WLD is sitting below both EMAs in a bearish stack on the 4h chart, so the trend points lower. Price is at 0.329 on the perp chart, down 1.14%, with a mark price of 0.329, a 24h high of 0.350, a 24h low of 0.327, and 24h volume of 200.27M WLD (65.91M USDT). The signal chart shows 0.3297000, down 4.46% in 24h.
SHORT setup: 72% confidence, 7 of 12 signals aligned, up to 2.00R reward-to-risk.
Entry: 0.3286765 – 0.3295235
TP1: 0.3191971 (-3.0%)
TP2: 0.3125952 (-5.0%)
TP3: 0.3026923 (-8.0%)
SL: 0.3423039 (+4.0%)
Last 1H candle: O 0.3335000, H 0.3342000, L 0.3272000, C 0.3297000 (-1.14%). Perp chart: MA(7) 0.334, MA(25) 0.338, MA(99) 0.340; EMA34 0.340, EMA89 0.352, EMA200 0.371. Signal chart: MA 7 0.3344143, MA 25 0.3390360, MA 99 0.3579667. RSI(6) 18.79, RSI(12) 28.36, RSI(24) 40.07. MACD 12 26 9: -0.0031, -0.0027, -0.0004. Volume 22.82M, MA(5) 12.71M, MA(10) 10.4M. Charts are 1H candles, as of 7 Nov 2026, 20:00 UTC. Trade plan panel: stop 0.3423039 (+4.01%), entry 0.3291000, TP1 0.3191971 (-3.01%), TP2 0.3125952 (-5.02%), TP3 0.3026923 (-8.02%).
Volume profile (120 bars): price is below the value area. Point of control 0.3766214, value area high 0.3966571, value area low 0.3459000; last price is 12.46% below the point of control.
Why: the 4h trend shows price below EMA50 and EMA200 in a bearish stack, meaning the swing trend is down.
Risk: price is far below its average, so a bounce is likely (-4.1 ATR from the 1h EMA50).
Plan: close 50% at TP1, 25% at TP2, 25% at TP3, and move the stop to entry after TP1.
Do you see this as a good short entry?