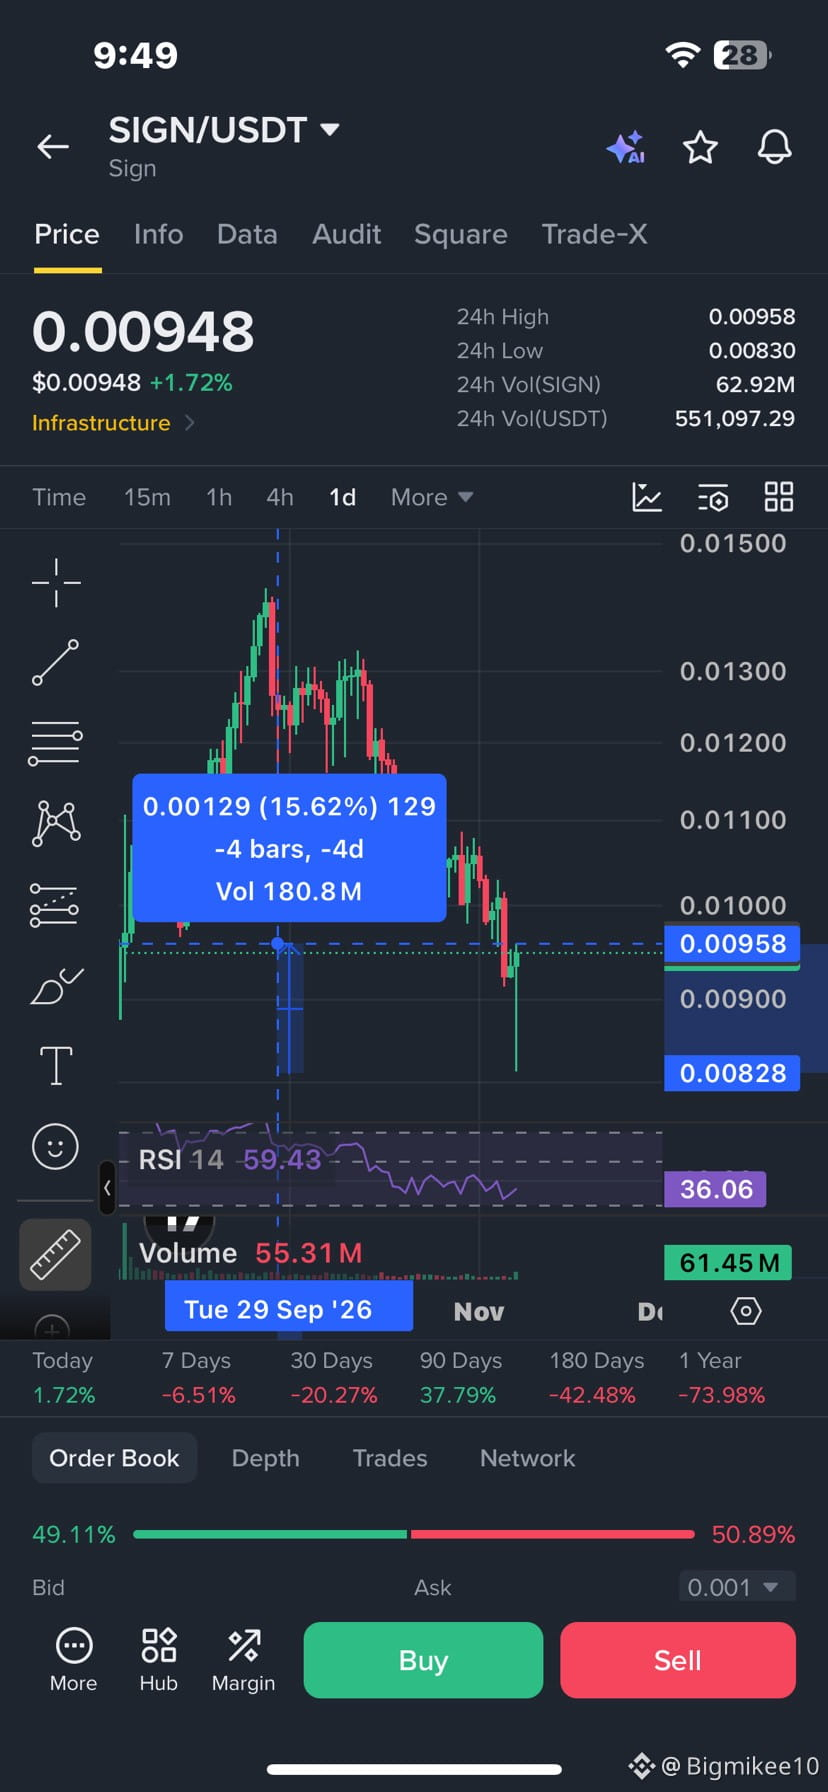
SIGN has been showing an interesting price action on the 1D chart. Price previously pushed strongly toward the 0.0130– 0.0140 zone before facing selling pressure and entering a correction. After that decline, SIGN swept the liquidity below the 0.0090 support area, with a sharp downside wick reaching approximately 0.00828–0.00830. This move looks like a potential liquidity grab, where price dipped below previous lows before buyers stepped in.
The important development is how SIGN reacted after tapping that liquidity zone. Instead of continuing aggressively downward, price recovered toward 0.00948, showing a potential rejection of lower prices. Immediate support sits around 0.00900, while the stronger demand and liquidity zone remains around 0.00830.
On the upside, immediate resistance is around 0.00958, followed by 0.01000– 0.01050. A convincing daily close above these levels could open the door toward 0.01100 and potentially higher resistance zones.
TPs & SL:
Entry zone: 0.00920–$0.00950
TP1: 0.01000
TP2: 0.01050
TP3: 0.01100
TP4: - 0.01200
SL Below 0.00820
DCA at 0.00865
$SIGN $IDOL #Write2Earn $AIN
The important development is how SIGN reacted after tapping that liquidity zone. Instead of continuing aggressively downward, price recovered toward 0.00948, showing a potential rejection of lower prices. Immediate support sits around 0.00900, while the stronger demand and liquidity zone remains around 0.00830.
On the upside, immediate resistance is around 0.00958, followed by 0.01000– 0.01050. A convincing daily close above these levels could open the door toward 0.01100 and potentially higher resistance zones.
TPs & SL:
Entry zone: 0.00920–$0.00950
TP1: 0.01000
TP2: 0.01050
TP3: 0.01100
TP4: - 0.01200
SL Below 0.00820
DCA at 0.00865
$SIGN $IDOL #Write2Earn $AIN