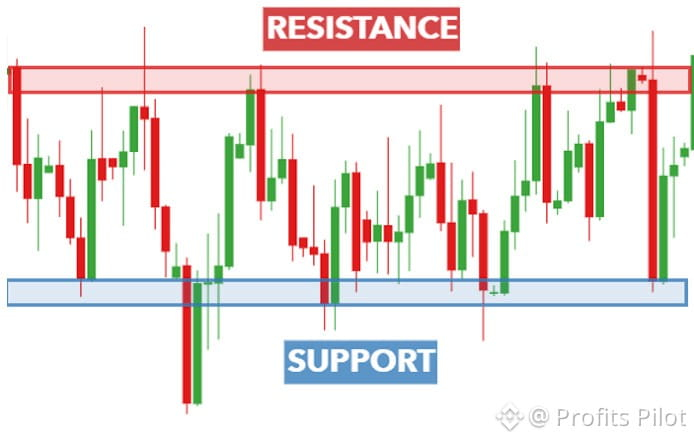
HOW TO FIND SUPPORT AND RESISTANCE IN ANY CRYPTO COIN? 📊
Every successful trade starts with understanding the chart. If you don't know where buyers and sellers are likely to step in, you're trading without a clear roadmap.
Let's understand it in the simplest way.
1. What Is Support
Support is a price area where buyers have previously entered the market and stopped the price from falling further.
Think of it as a floor. When price returns to this area, buyers may step in again.
2. What Is Resistance
Resistance is a price area where sellers have previously entered and pushed the price down.
Think of it as a ceiling. When price reaches this area, selling pressure may appear again.
3. How To Find These Levels
Open any coin on TradingView and follow these steps.
First, select the 1D timeframe to understand the bigger market structure.
Look at the chart and identify areas where price has reversed multiple times.
Mark the previous swing lows as potential support zones.
Mark the previous swing highs as potential resistance zones.
Focus on areas where price has reacted more than once. These levels usually deserve more attention.
4. Which Timeframe Should You Use
1D timeframe for major support and resistance.
4H timeframe for stronger confirmation of nearby levels.
15M or 5M timeframe for short-term trading entries.
5. Important Rule Every Trader Should Know
Support and resistance are zones, not exact prices.
A support level can break. Resistance can turn into support after a breakout, and support can turn into resistance after a breakdown.
Always watch how price reacts around these areas instead of blindly placing trades.
PRO TIP: The more meaningful reactions a zone has, the more attention it deserves. But no level is guaranteed to hold.
Now tell me, which timeframe do you use most to find Support and Resistance?
Follow Profits Pilot for more practical crypto trading lessons. 🚀
$AIN Now Find in These Coins 👇
$ONE
$BTC
Every successful trade starts with understanding the chart. If you don't know where buyers and sellers are likely to step in, you're trading without a clear roadmap.
Let's understand it in the simplest way.
1. What Is Support
Support is a price area where buyers have previously entered the market and stopped the price from falling further.
Think of it as a floor. When price returns to this area, buyers may step in again.
2. What Is Resistance
Resistance is a price area where sellers have previously entered and pushed the price down.
Think of it as a ceiling. When price reaches this area, selling pressure may appear again.
3. How To Find These Levels
Open any coin on TradingView and follow these steps.
First, select the 1D timeframe to understand the bigger market structure.
Look at the chart and identify areas where price has reversed multiple times.
Mark the previous swing lows as potential support zones.
Mark the previous swing highs as potential resistance zones.
Focus on areas where price has reacted more than once. These levels usually deserve more attention.
4. Which Timeframe Should You Use
1D timeframe for major support and resistance.
4H timeframe for stronger confirmation of nearby levels.
15M or 5M timeframe for short-term trading entries.
5. Important Rule Every Trader Should Know
Support and resistance are zones, not exact prices.
A support level can break. Resistance can turn into support after a breakout, and support can turn into resistance after a breakdown.
Always watch how price reacts around these areas instead of blindly placing trades.
PRO TIP: The more meaningful reactions a zone has, the more attention it deserves. But no level is guaranteed to hold.
Now tell me, which timeframe do you use most to find Support and Resistance?
Follow Profits Pilot for more practical crypto trading lessons. 🚀
$AIN Now Find in These Coins 👇
$ONE
$BTC