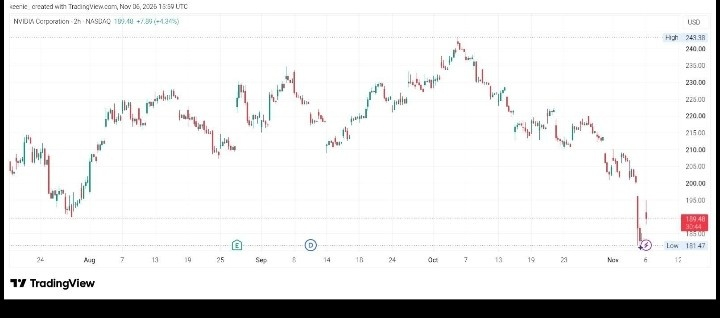

NVIDIA is facing renewed selling pressure after a prolonged period of weakness pushed its share price significantly lower. On the 2-hour TradingView chart, NVDA has experienced a sharp decline from its October highs around $244, with the latest movement bringing the stock toward the $190 region. This sudden drop has attracted attention as investors watch whether buyers can regain control or whether another downward move is approaching.
Looking at the broader chart, NVIDIA previously demonstrated strong upward momentum between August and early October. The stock climbed from the lower price regions and eventually reached a high around $244. However, that bullish momentum gradually weakened, and sellers began taking control as the price struggled to maintain its position above previous levels.
Throughout October, the chart started showing a series of lower highs and lower lows. This pattern suggests that buying pressure was weakening while sellers became increasingly confident. Several recovery attempts failed to establish a sustained upward movement, allowing the downward structure to develop further.
The latest sharp decline is particularly important because it pushed NVDA toward the $181.47 low displayed on the chart. After reaching this area, the stock showed signs of a short-term rebound. However, one recovery attempt is not enough to confirm a trend reversal, especially after such a significant drop.
For the bullish scenario, I would first watch the $195–$200 region. If buyers can maintain the current recovery and reclaim $200, it could improve short-term sentiment and create an opportunity for a move toward $205. A stronger recovery could eventually bring $210 into focus, although buyers would need to overcome resistance along the way.
On the bearish side, failure to sustain the current rebound could bring the $190 region back into focus. If selling pressure increases and the price returns toward $181.47, traders will be watching closely to see whether buyers can defend the recent low. A decisive breakdown below that level would further weaken the market structure.
NVIDIA's performance is also influenced by developments across the semiconductor and artificial intelligence industries. Investor expectations, competition, chip demand, earnings performance and broader technology-sector sentiment can all affect the stock. These factors may contribute to volatility alongside the technical signals visible on the chart.
For now, my attention remains on the reaction around $181.47 and whether buyers can push the stock back above $200. A sustained recovery would provide an early indication of improving momentum, while another rejection could suggest that sellers remain in control. I would rather wait for confirmation than assume that the latest rebound marks the end of the decline.
NVIDIA is approaching an important point in its current market structure. The stock has experienced a substantial correction from its October high, and the next confirmed movement could provide a clearer picture of its short-term direction. Buyers need to demonstrate stronger momentum if they want to challenge the current bearish structure.
What do you think? Can NVDA recover above $200 and move toward $210, or will sellers push the stock back toward the $181 support area?
This analysis is for educational purposes only and should not be considered financial advice. Always DYOR before making investment decisions.$rNVDA $NVDA
#JobsReportRaisesHikeOdds #CPITestsDecemberRateOutlook #BitcoinRebounds$75KAsChipsLead