

28 minutes ago
XLM - Critical Support Retest, Is a Major Reversal Approaching?
0Grab this chart
4
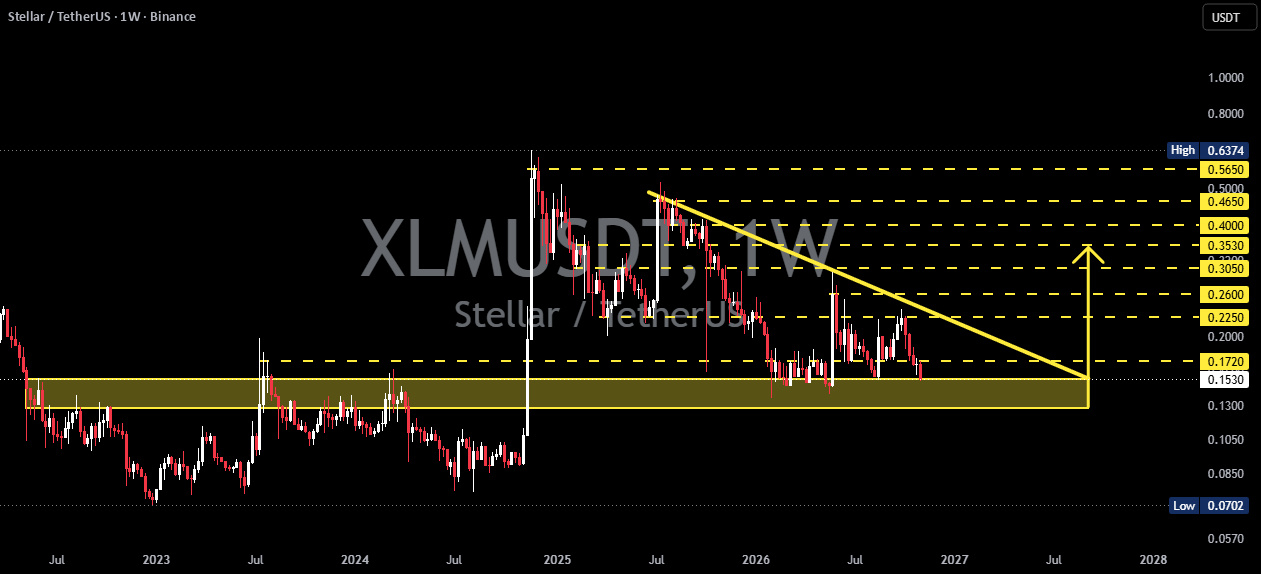
🔎 Stellar (XLM) is once again retesting its major support block between $0.153 and $0.128. This zone represents an important technical area that previously acted as a price consolidation range and could potentially serve as a foundation for XLM's next major move.
Currently, XLM is still trading below the descending trendline, indicating that the longer-term bearish pressure has not yet fully disappeared.
However, this retest of the major support block presents an important opportunity to observe whether buyers can defend this area and potentially trigger a trend reversal.
Let's examine both possible scenarios.
---
## 🔍 1. Pattern Analysis and Market Structure
📉 Descending Trendline
Since reaching its peak around $0.6374 in late 2024, XLM has developed a price structure characterized by consecutive Lower Highs.
The descending trendline visible on the chart indicates that every recovery attempt continues to face selling pressure at progressively lower resistance levels.
As long as price has not successfully broken above and confirmed a breakout from this trendline, the medium- to long-term bearish structure remains relevant.
🟡 Major Support Block: $0.153–$0.128
This is the primary area of focus in this analysis.
Several factors make this zone technically important:
- 🟢 It represents a historical price consolidation area.
- 🟢 It previously served as a region of significant trading activity.
- 🟢 It could become an accumulation zone if buyers regain control.
- 🟢 It serves as a critical boundary for determining whether the current price structure can hold or whether further downside is likely.
Therefore, price action within the $0.153–$0.128 zone will be one of the key factors determining XLM's next potential direction.
## 🟢 2. Bullish Scenario
If XLM manages to defend the $0.153–$0.128 support block and demonstrates a strong buying response, the possibility of a price recovery could increase.
Several bullish confirmations to watch for:
- ✅ Price holds above the $0.153–$0.128 support zone.
- ✅ A bullish reversal pattern develops on the Weekly timeframe.
- ✅ Buying volume begins to increase.
- ✅ Price successfully breaks above the Descending Trendline.
🎯 Bullish Resistance Targets:
| Target | Price Level |
|---|---:|
| TP 1 | $0.1720 |
| TP 2 | $0.2250 |
| TP 3 | $0.2600 |
| TP 4 | $0.3050 |
| TP 5 | $0.3530 |
| TP 6 | $0.4000 |
| TP 7 | $0.4650 |
🚀 If bullish momentum strengthens and XLM successfully breaks through these resistance levels, a potential move toward $0.4650–$0.5650 could become the next area of interest.
A breakout followed by a weekly close above the Descending Trendline would provide an important confirmation that bearish market dominance is beginning to weaken.
## 🔴 3. Bearish Scenario
On the other hand, if XLM fails to defend the $0.153–$0.128 support block and experiences a breakdown accompanied by strong selling pressure, the risk of further downside should not be ignored.
⚠️ Several bearish confirmations to watch for:
- ❌ Price loses the $0.128 support level.
- ❌ A weekly candle closes below the support block.
- ❌ Selling volume increases as support breaks down.
- ❌ Price fails to reclaim the $0.128–$0.153 zone.
If these conditions occur, the support structure that has been holding price could potentially turn into resistance.
📉 Under these circumstances, XLM could experience further downside as price searches for lower demand zones.
The $0.128 level serves as the primary invalidation boundary for the current support-holding scenario. The chart does not yet establish a definitive downside target.
## 📊 4. Key Levels to Watch
Based on the Weekly chart structure, the following price levels are worth monitoring:
| Price Level | Description |
|---|---|
| $0.1280–$0.1530 | 🟡 Major Support Block |
| $0.1720 | 🔴 Resistance 1 |
| $0.2250 | 🔴 Resistance 2 |
| $0.2600 | 🔴 Resistance 3 |
| $0.3050 | 🔴 Resistance 4 |
| $0.3530 | 🔴 Resistance 5 |
| $0.4000 | 🔴 Resistance 6 |
| $0.4650 | 🔴 Resistance 7 |
| $0.5650 | 🎯 Major Resistance |
📌 Note: These levels represent technical zones identified on the chart and do not guarantee that price will reach them.
## ⚖️ 5. Conclusion and Market Outlook
Stellar (XLM) is currently approaching a critical technical area after retesting the $0.153–$0.128 support block.
From a longer-term perspective, there are two possible scenarios to consider.
🟢 Bullish Outlook:
If buyers successfully defend the support zone and push price above the Descending Trendline, XLM could potentially begin a recovery phase, with successive resistance targets at $0.1720, $0.2250, and $0.3050.
🔴 Bearish Outlook:
However, if selling pressure intensifies and price loses the $0.1280 level through a confirmed weekly close, the possibility of further downside would increase.
🔍 My Key Observation:
The $0.153–$0.128 area is an extremely important zone to monitor. Price action within this region could provide clues as to whether XLM is building a foundation for its next recovery or preparing for another continuation of the bearish trend.
For now, confirmation remains the key. Avoid prematurely calling a trend reversal before a valid breakout occurs.