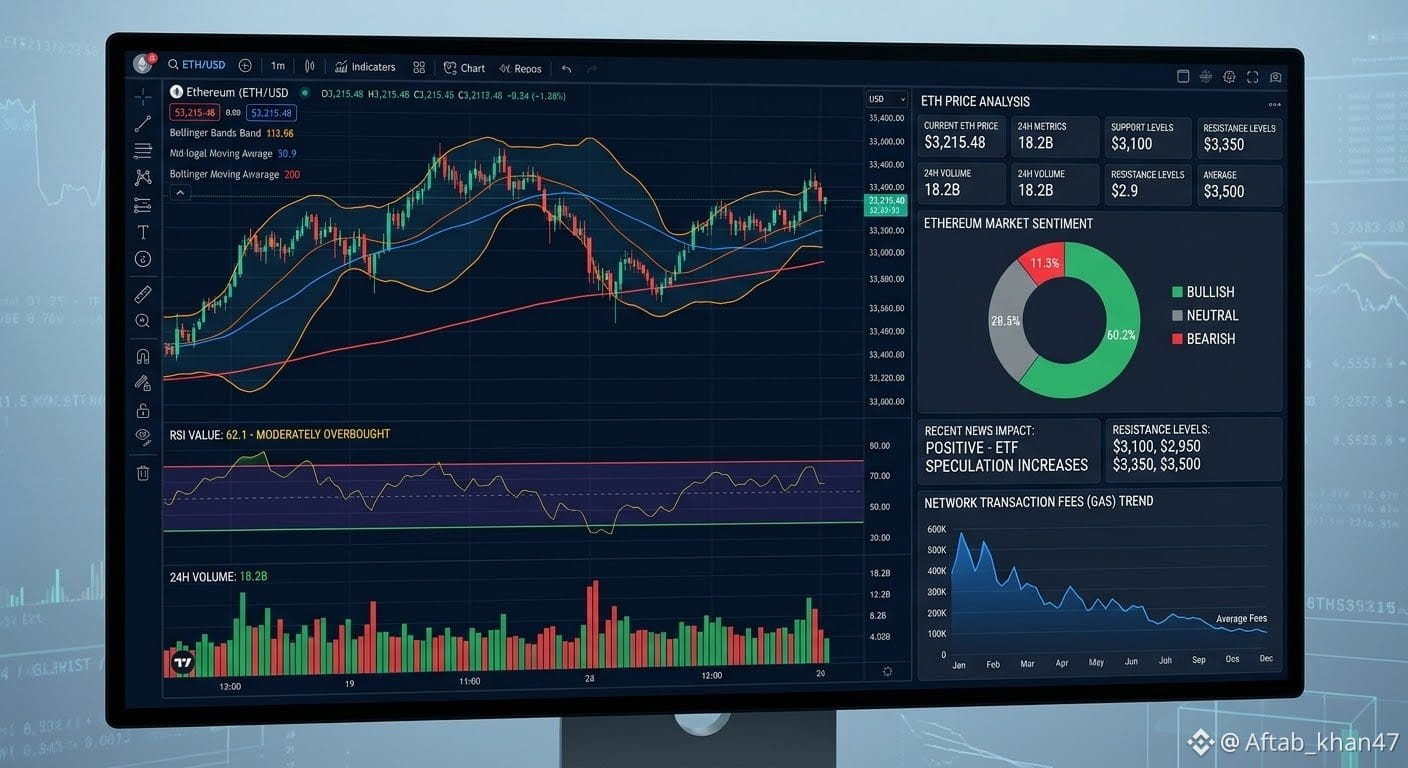
$ETH ETH/USD Descriptive Analysis: Nov 07, 2026
Our technical snapshot reveals that Ethereum is navigating a critical juncture. The predominant chart structure is a Descending Triangle, defined by a downward-sloping resistance line and a clear horizontal support floor at $2,100. This pattern represents a period of intense compression, indicating that market participants are expecting a significant expansion in volatility once a breakout occurs.
Key Highlights from the Chart
Immediate Range: ETH is clustering just above the crucial $2,100 Support Zone. This level has served as a psychological and structural floor for multiple months.
The Volatility Trap: The price is approaching the apex of the triangle. The distance between resistance and support is shrinking, meaning a decisive move is imminent.#JobsReportRaisesHikeOdds #AnthropicStillPlansPreThanksgivingIPO #WillAnthropicListOnTime
Our technical snapshot reveals that Ethereum is navigating a critical juncture. The predominant chart structure is a Descending Triangle, defined by a downward-sloping resistance line and a clear horizontal support floor at $2,100. This pattern represents a period of intense compression, indicating that market participants are expecting a significant expansion in volatility once a breakout occurs.
Key Highlights from the Chart
Immediate Range: ETH is clustering just above the crucial $2,100 Support Zone. This level has served as a psychological and structural floor for multiple months.
The Volatility Trap: The price is approaching the apex of the triangle. The distance between resistance and support is shrinking, meaning a decisive move is imminent.#JobsReportRaisesHikeOdds #AnthropicStillPlansPreThanksgivingIPO #WillAnthropicListOnTime