🚀 $QNT Explodes 23% — Is This the Start of a Bigger Recovery? ⚡
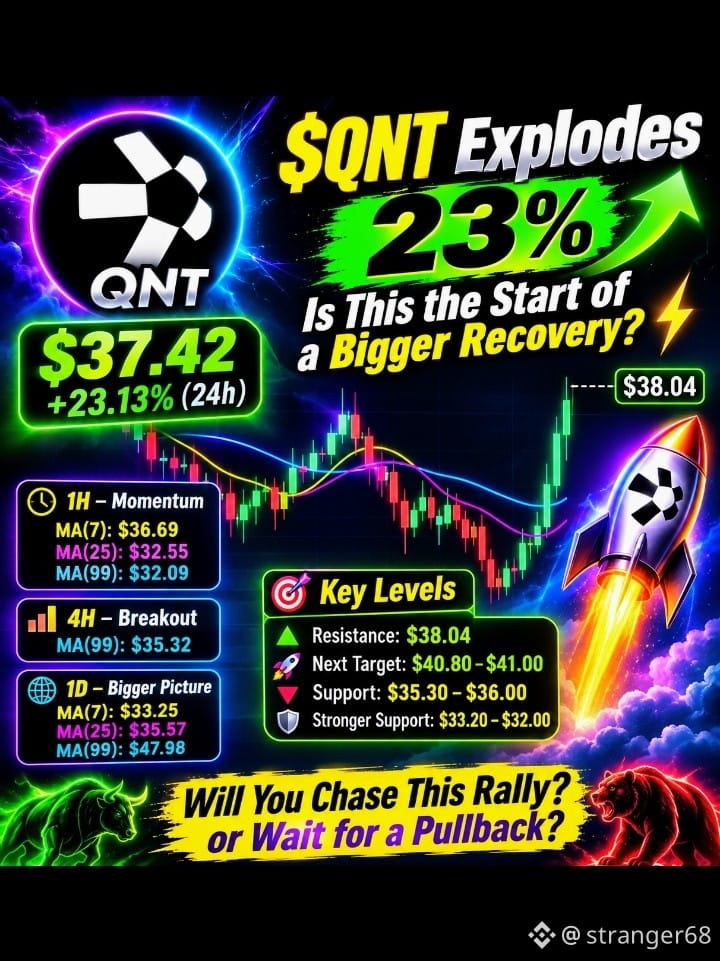
🔥 A powerful move is putting Quant back in the spotlight! Trading at $37.42, up 23.13% in 24 hours, the market is showing a sharp shift in momentum. Buyers have pushed price from the $29.67 daily low toward $38.04, bringing an important breakout zone into focus.
⏱️ 1H — Momentum Takes Control
- Price: $37.42
- MA(7): $36.69
- MA(25): $32.55
- MA(99): $32.09
Price is trading above all three moving averages. Short-term momentum remains strong, although a brief pullback after such a sharp rally would not be surprising.
📊 4H — Breakout Structure
The price has moved above the key moving averages, including MA(99) at $35.32.
This is an encouraging shift in the short-term structure. Holding above $35.30–$36.00 could help buyers maintain control.
🌍 1D — Bigger Picture
- MA(7): $33.25
- MA(25): $35.57
- MA(99): $47.98
The daily chart is showing signs of recovery, with price now above MA(7) and MA(25). However, MA(99) remains much higher, meaning the broader recovery still has work to do.
🎯 Key Levels to Watch
🟢 Immediate resistance: $38.04
🚀 Next upside zone: $40.80–$41.00
🔴 First support: $35.30–$36.00
⚠️ Stronger support: $33.20–$32.00
💡 My Take: The momentum is impressive, but the real test is whether buyers can defend the breakout and push through $38.04. A convincing move above this level could open the door toward $40.80. Failure to hold support could bring a cooling-off period.
🔥 Would you chase this rally, or wait for a pullback before considering an entry?
#QNT #CryptoTrading #BinanceSquare
#JobsReportRaisesHikeOdds #USMidtermsCouldShakeUpUS-IranTies #USNovemberMichiganExpectationsIndexPrelimAt50.9 #TradFiForBeginners
🔥 A powerful move is putting Quant back in the spotlight! Trading at $37.42, up 23.13% in 24 hours, the market is showing a sharp shift in momentum. Buyers have pushed price from the $29.67 daily low toward $38.04, bringing an important breakout zone into focus.
⏱️ 1H — Momentum Takes Control
- Price: $37.42
- MA(7): $36.69
- MA(25): $32.55
- MA(99): $32.09
Price is trading above all three moving averages. Short-term momentum remains strong, although a brief pullback after such a sharp rally would not be surprising.
📊 4H — Breakout Structure
The price has moved above the key moving averages, including MA(99) at $35.32.
This is an encouraging shift in the short-term structure. Holding above $35.30–$36.00 could help buyers maintain control.
🌍 1D — Bigger Picture
- MA(7): $33.25
- MA(25): $35.57
- MA(99): $47.98
The daily chart is showing signs of recovery, with price now above MA(7) and MA(25). However, MA(99) remains much higher, meaning the broader recovery still has work to do.
🎯 Key Levels to Watch
🟢 Immediate resistance: $38.04
🚀 Next upside zone: $40.80–$41.00
🔴 First support: $35.30–$36.00
⚠️ Stronger support: $33.20–$32.00
💡 My Take: The momentum is impressive, but the real test is whether buyers can defend the breakout and push through $38.04. A convincing move above this level could open the door toward $40.80. Failure to hold support could bring a cooling-off period.
🔥 Would you chase this rally, or wait for a pullback before considering an entry?
#QNT #CryptoTrading #BinanceSquare
#JobsReportRaisesHikeOdds #USMidtermsCouldShakeUpUS-IranTies #USNovemberMichiganExpectationsIndexPrelimAt50.9 #TradFiForBeginners