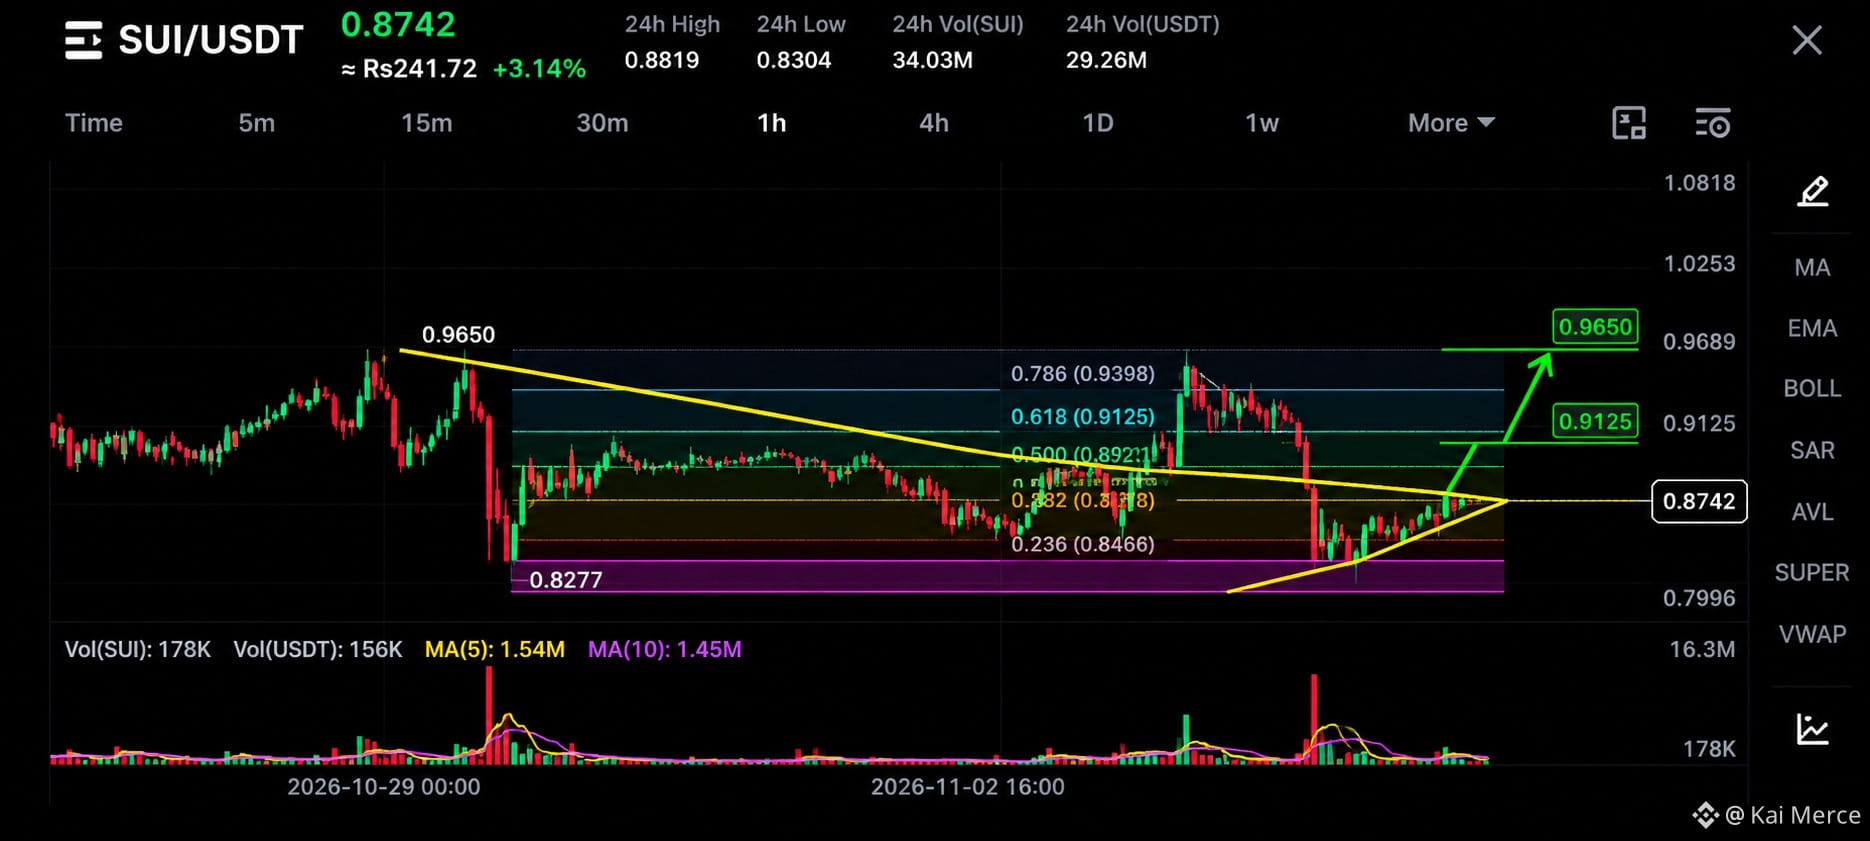

$SUI Symmetrical Triangle Breakout Setup
Entry Zone: 0.8650–0.8800
Stop Loss: 0.8270
TP1: 0.9125
TP2: 0.9398
TP3: 0.9650
Market Analysis:
SUIUSDT is approaching an important decision point after recovering from its 0.8277 low. The 1H chart shows price consolidating inside a tightening structure, with a descending resistance trendline meeting rising support. This compression suggests that a stronger directional move could be approaching.
Currently trading around 0.8742, SUI is testing the upper boundary of this formation. Buyers are attempting to regain control, but confirmation above the trendline remains essential.
The 0.8920–0.9125 region is the first important resistance area. A successful breakout above this zone could open the way toward 0.9398, followed by the previous major resistance at 0.9650.
Confirmation: A strong 1H candle close above 0.8920, followed by a successful retest, would strengthen the bullish breakout scenario.
Invalidation: A breakdown below 0.8277 would weaken the current recovery structure and increase downside risk.
SUI is approaching a critical technical zone. Patience, volume confirmation, and proper risk management are essential before entering this setup.
Entry Zone: 0.8650–0.8800
Stop Loss: 0.8270
TP1: 0.9125
TP2: 0.9398
TP3: 0.9650
Market Analysis:
SUIUSDT is approaching an important decision point after recovering from its 0.8277 low. The 1H chart shows price consolidating inside a tightening structure, with a descending resistance trendline meeting rising support. This compression suggests that a stronger directional move could be approaching.
Currently trading around 0.8742, SUI is testing the upper boundary of this formation. Buyers are attempting to regain control, but confirmation above the trendline remains essential.
The 0.8920–0.9125 region is the first important resistance area. A successful breakout above this zone could open the way toward 0.9398, followed by the previous major resistance at 0.9650.
Confirmation: A strong 1H candle close above 0.8920, followed by a successful retest, would strengthen the bullish breakout scenario.
Invalidation: A breakdown below 0.8277 would weaken the current recovery structure and increase downside risk.
SUI is approaching a critical technical zone. Patience, volume confirmation, and proper risk management are essential before entering this setup.