ake$AKE 📚 Education: What This AKE/USDT Chart Teaches Us
1. Big % gains ≠ safe entries
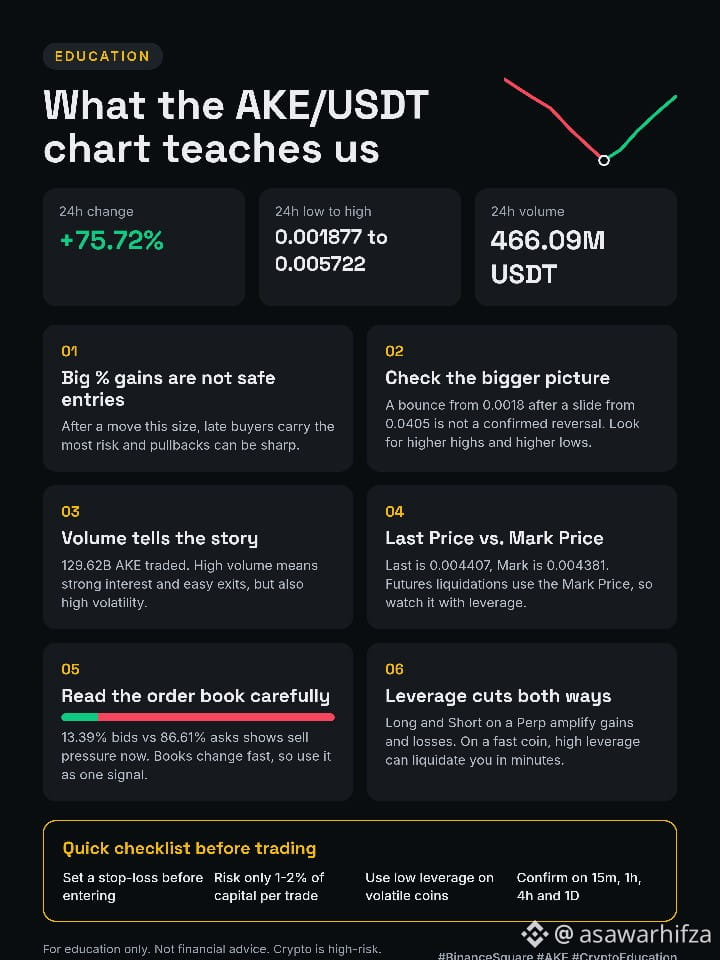
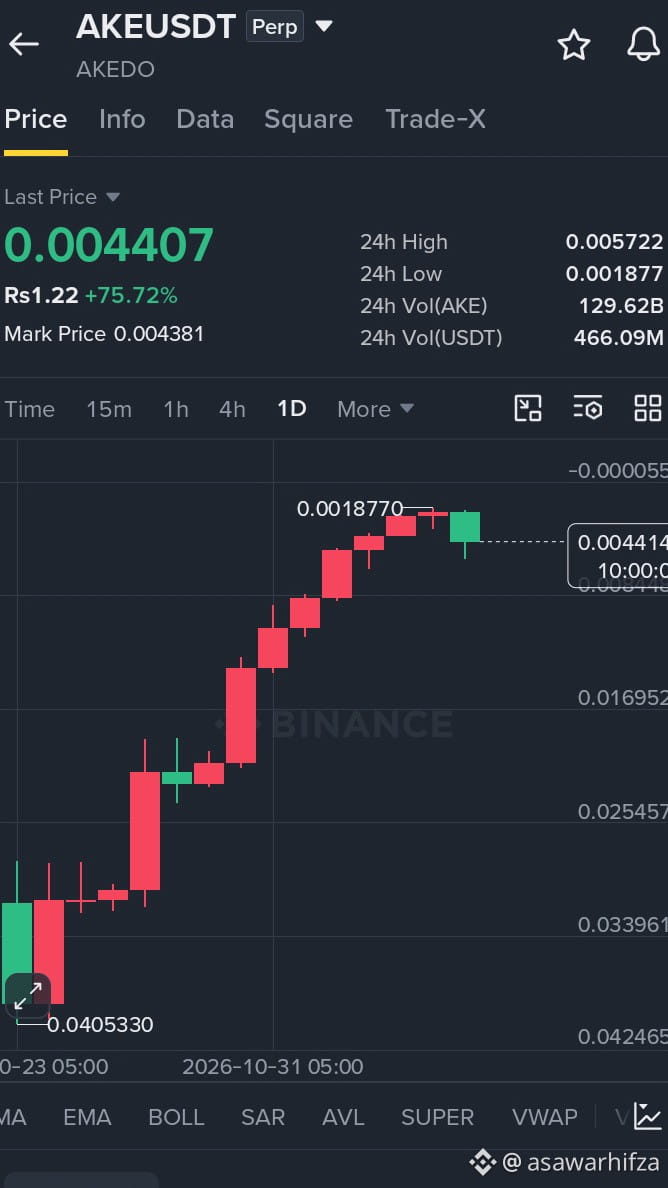
AKE is up +75.72% in 24h, moving from a low of 0.001877 to a high of 0.005722. After a move that size, late buyers carry the most risk, and pullbacks can be sharp.
2. Check the bigger picture
The daily chart shows a long decline from the 0.0405 area down to about 0.0018, followed by a bounce. A bounce inside a downtrend is not automatically a trend reversal. Look for higher highs and higher lows to confirm.
3. Volume tells the story
24h volume is 129.62B AKE (about 466M USDT). High volume means strong interest and easier entries and exits, but it also means volatility.
4. Last Price vs. Mark Price
Last Price is 0.004407 and Mark Price is 0.004381. Futures liquidations use the Mark Price, not the Last Price, so watch it when using leverage.
5. Read the order book carefully
The book shows 13.39% bids vs 86.61% asks, which means heavy sell-side pressure at the moment. Order books change fast and can be spoofed, so use this as one signal, not a verdict.
6. Leverage cuts both ways
Long and Short on a Perp amplify gains and losses. On a coin moving this fast, high leverage can liquidate you in minutes.$AKE ✅ Quick checklist before trading
Set a stop-loss before entering
Risk only 1-2% of your capital per trade
Use low leverage on volatile coins
Confirm on multiple timeframes (15m, 1h, 4h, 1D)
⚠️ This post is for education only and is not financial advice. Crypto is high-risk. Always DYOR.$AKE #AKE #BinanceSquareTalks #crypto #USDT #USDT
1. Big % gains ≠ safe entries
AKE is up +75.72% in 24h, moving from a low of 0.001877 to a high of 0.005722. After a move that size, late buyers carry the most risk, and pullbacks can be sharp.
2. Check the bigger picture
The daily chart shows a long decline from the 0.0405 area down to about 0.0018, followed by a bounce. A bounce inside a downtrend is not automatically a trend reversal. Look for higher highs and higher lows to confirm.
3. Volume tells the story
24h volume is 129.62B AKE (about 466M USDT). High volume means strong interest and easier entries and exits, but it also means volatility.
4. Last Price vs. Mark Price
Last Price is 0.004407 and Mark Price is 0.004381. Futures liquidations use the Mark Price, not the Last Price, so watch it when using leverage.
5. Read the order book carefully
The book shows 13.39% bids vs 86.61% asks, which means heavy sell-side pressure at the moment. Order books change fast and can be spoofed, so use this as one signal, not a verdict.
6. Leverage cuts both ways
Long and Short on a Perp amplify gains and losses. On a coin moving this fast, high leverage can liquidate you in minutes.$AKE ✅ Quick checklist before trading
Set a stop-loss before entering
Risk only 1-2% of your capital per trade
Use low leverage on volatile coins
Confirm on multiple timeframes (15m, 1h, 4h, 1D)
⚠️ This post is for education only and is not financial advice. Crypto is high-risk. Always DYOR.$AKE #AKE #BinanceSquareTalks #crypto #USDT #USDT