🚨 BITCOIN AT $160,000? THE CHART IS SHOWING A PATTERN THAT'S HARD TO IGNORE.
Look closely at the structure.
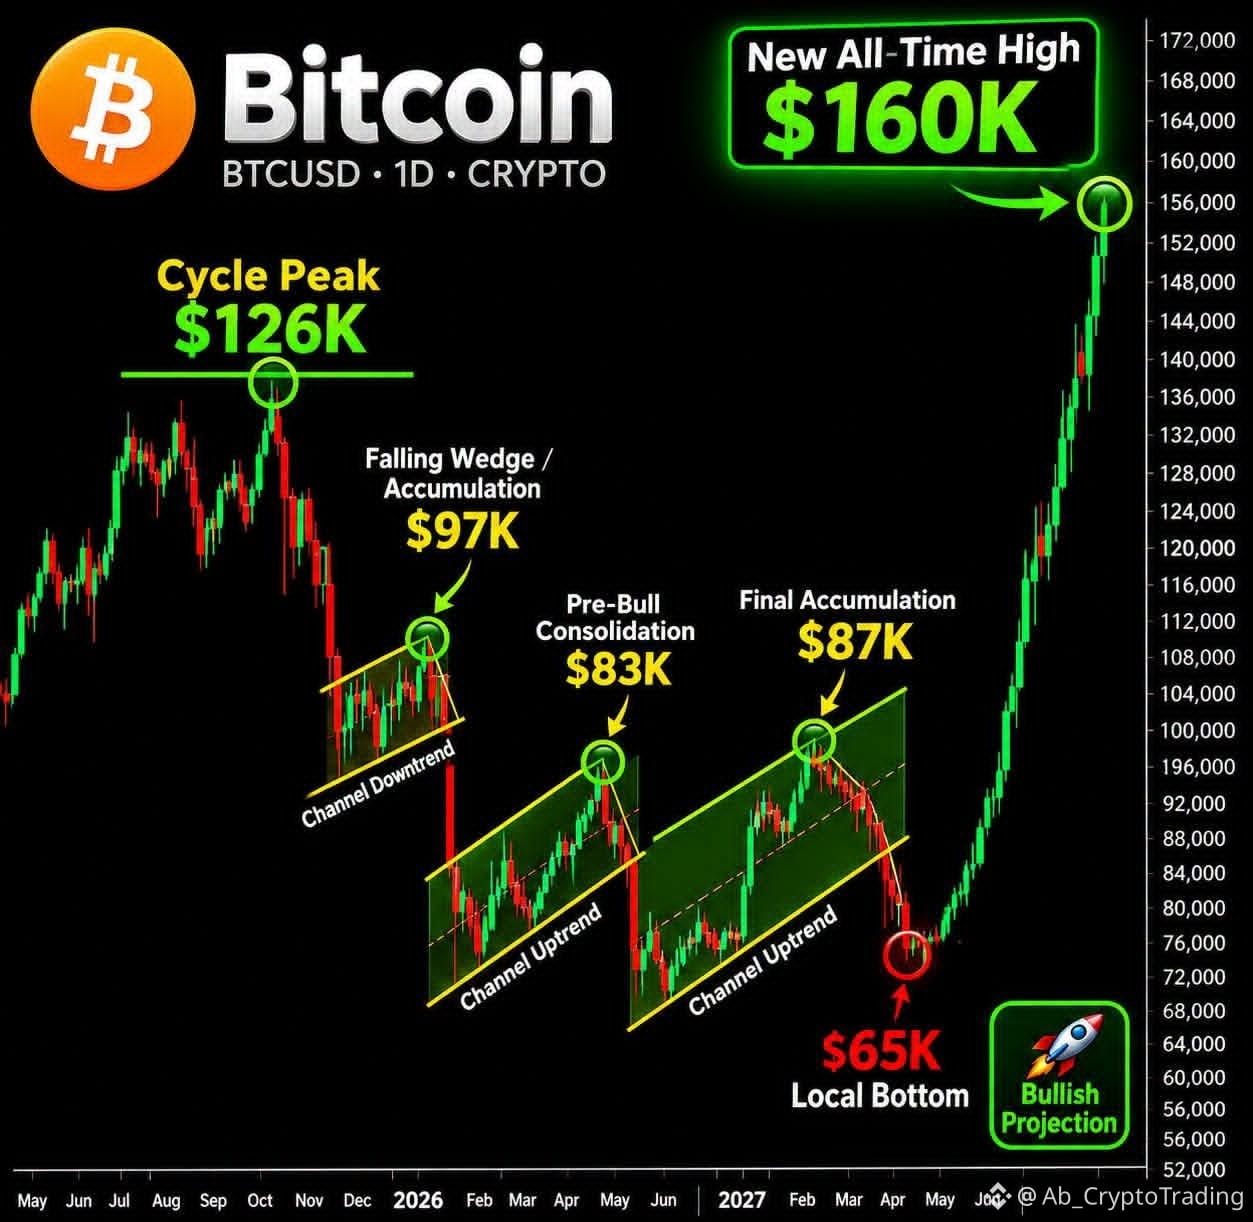
After reaching a previous cycle peak near $126K, Bitcoin went through several corrective phases:
- A potential accumulation zone around $97K.
- Another consolidation phase near $83K.
- A final setup around $87K.
- And a projected local bottom near $65K.
Now, the chart maps out a potential move toward $160,000 and a new all-time high.
But here's the real question:
Are we looking at a repeating Bitcoin market cycle, or are we simply connecting historical patterns to fit a bullish narrative?
If history repeats, the upside could be significant.
If this cycle is different, the old playbook may no longer work.
I want to hear both sides:
Is $160K a realistic next-cycle target, an overly optimistic projection, or could Bitcoin surprise everyone and go even higher?
Let's see what the market actually believes. 👇 $BTC
#BTC #BinanceReopensWithdrawalsForMoreAssets
#EarningsSeason #Write2Earn #Write2Earn!
Look closely at the structure.
After reaching a previous cycle peak near $126K, Bitcoin went through several corrective phases:
- A potential accumulation zone around $97K.
- Another consolidation phase near $83K.
- A final setup around $87K.
- And a projected local bottom near $65K.
Now, the chart maps out a potential move toward $160,000 and a new all-time high.
But here's the real question:
Are we looking at a repeating Bitcoin market cycle, or are we simply connecting historical patterns to fit a bullish narrative?
If history repeats, the upside could be significant.
If this cycle is different, the old playbook may no longer work.
I want to hear both sides:
Is $160K a realistic next-cycle target, an overly optimistic projection, or could Bitcoin surprise everyone and go even higher?
Let's see what the market actually believes. 👇 $BTC
#BTC #BinanceReopensWithdrawalsForMoreAssets
#EarningsSeason #Write2Earn #Write2Earn!