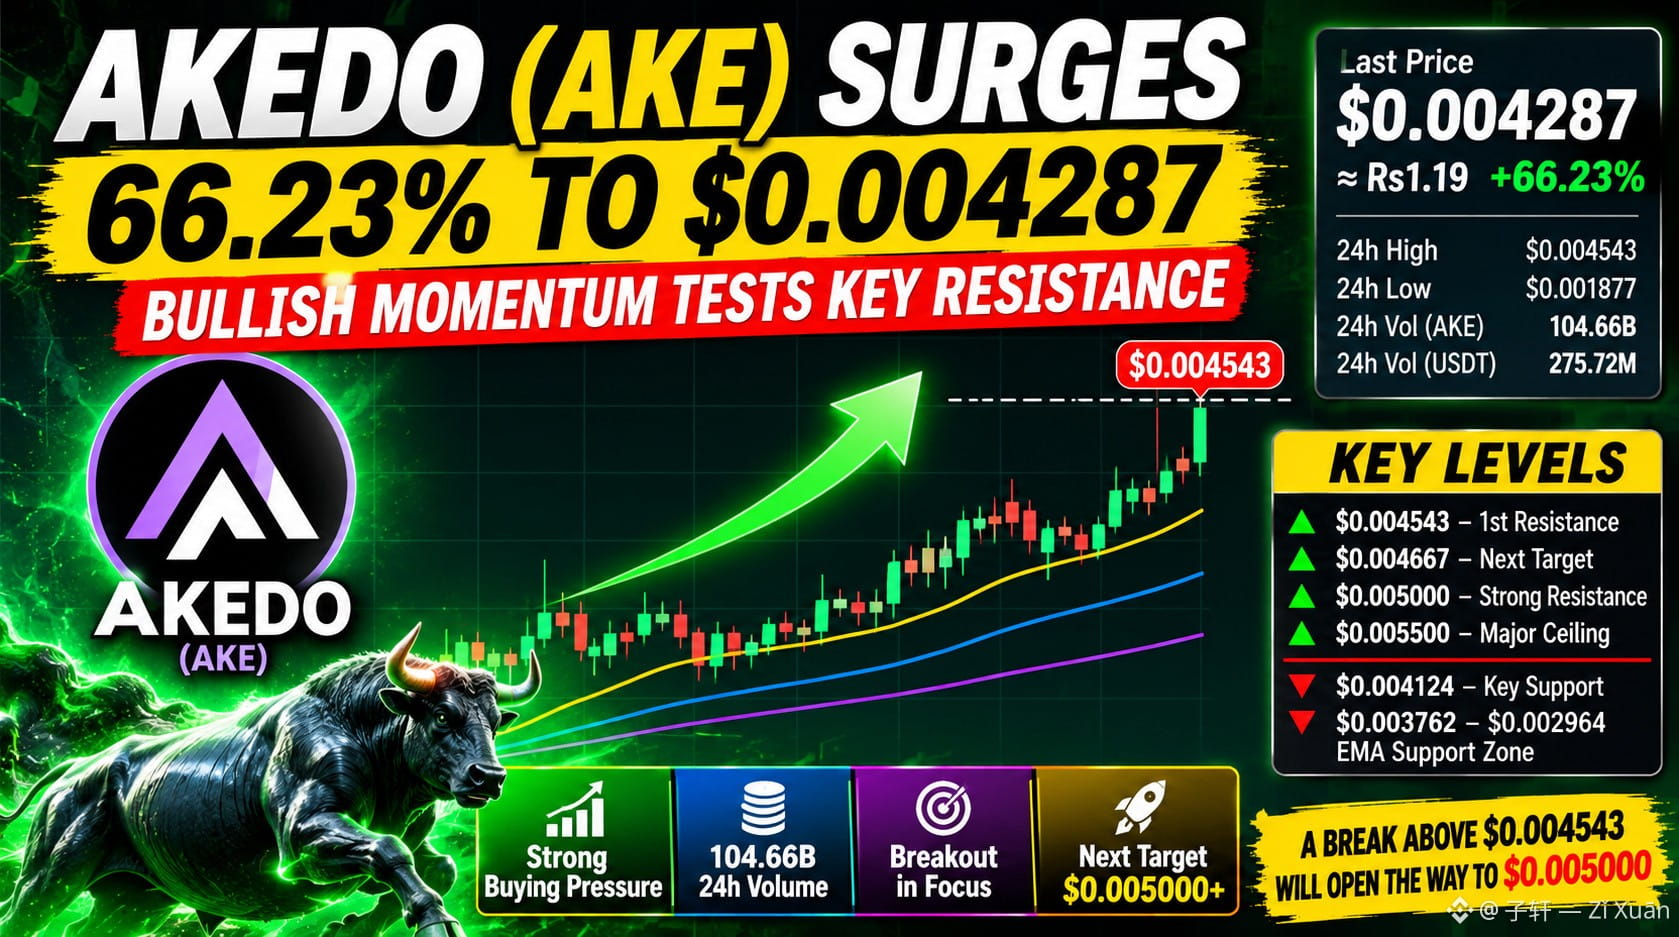

$AKE DO (AKE) SURGES 66.23% TO $0.004287 – BULLISH MOMENTUM TESTS KEY RESISTANCE
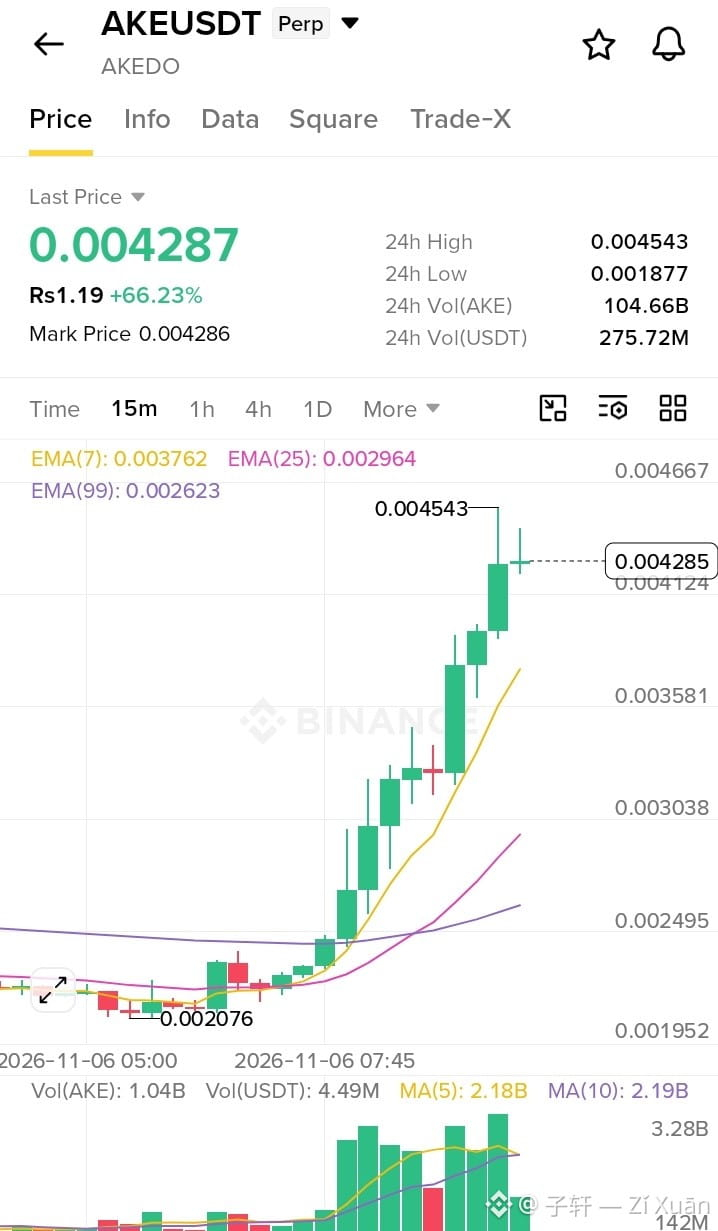
AKE has surged 66.23%, opening the new session with strong buying pressure. Price is testing the $0.004543 resistance after a sharp bullish breakout, while the short-term chart shows an expanding upward trend.
* 24h trading volume reached 104.66B AKE.
* $275.72M reported USDT turnover signals intense activity.
* Price remains above EMA(7), EMA(25) and EMA(99).
* The $0.004543 high is the immediate breakout barrier.
* Sharp volatility increases the risk of profit-taking.
* A rejection near resistance could trigger a deeper pullback.
Technical Structure: AKE is trading at $0.004287, above EMA(7) at $0.003762, EMA(25) at $0.002964 and EMA(99) at $0.002623. The short-term structure remains bullish. Daily SMA readings and RSI are not confirmed by the supplied chart, so no unverified values are included.
Levels:
▲ $0.004543 (24H High) – first barrier / next resistance ▲ $0.004667 (Chart Resistance) ▲ $0.005000 (Psychological Resistance) ▲ $0.005500 (Extended Target) – main ceiling
▼ $0.004124 (Immediate Support) – currently at stake ▼ $0.003762–$0.002964 (EMA Support Zone) — deep base
A break above $0.004543 will open the way to $0.004667 and potentially $0.005000. For a bullish continuation, a confirmed close above $0.004543 is needed.#StrategySTRCResumesIssuanceAfterOver170Days #USStocksSlipandCryptoMarketUnderBroadPressure #BinanceReopensWithdrawalsForMoreAssets
AKE has surged 66.23%, opening the new session with strong buying pressure. Price is testing the $0.004543 resistance after a sharp bullish breakout, while the short-term chart shows an expanding upward trend.
* 24h trading volume reached 104.66B AKE.
* $275.72M reported USDT turnover signals intense activity.
* Price remains above EMA(7), EMA(25) and EMA(99).
* The $0.004543 high is the immediate breakout barrier.
* Sharp volatility increases the risk of profit-taking.
* A rejection near resistance could trigger a deeper pullback.
Technical Structure: AKE is trading at $0.004287, above EMA(7) at $0.003762, EMA(25) at $0.002964 and EMA(99) at $0.002623. The short-term structure remains bullish. Daily SMA readings and RSI are not confirmed by the supplied chart, so no unverified values are included.
Levels:
▲ $0.004543 (24H High) – first barrier / next resistance ▲ $0.004667 (Chart Resistance) ▲ $0.005000 (Psychological Resistance) ▲ $0.005500 (Extended Target) – main ceiling
▼ $0.004124 (Immediate Support) – currently at stake ▼ $0.003762–$0.002964 (EMA Support Zone) — deep base
A break above $0.004543 will open the way to $0.004667 and potentially $0.005000. For a bullish continuation, a confirmed close above $0.004543 is needed.#StrategySTRCResumesIssuanceAfterOver170Days #USStocksSlipandCryptoMarketUnderBroadPressure #BinanceReopensWithdrawalsForMoreAssets