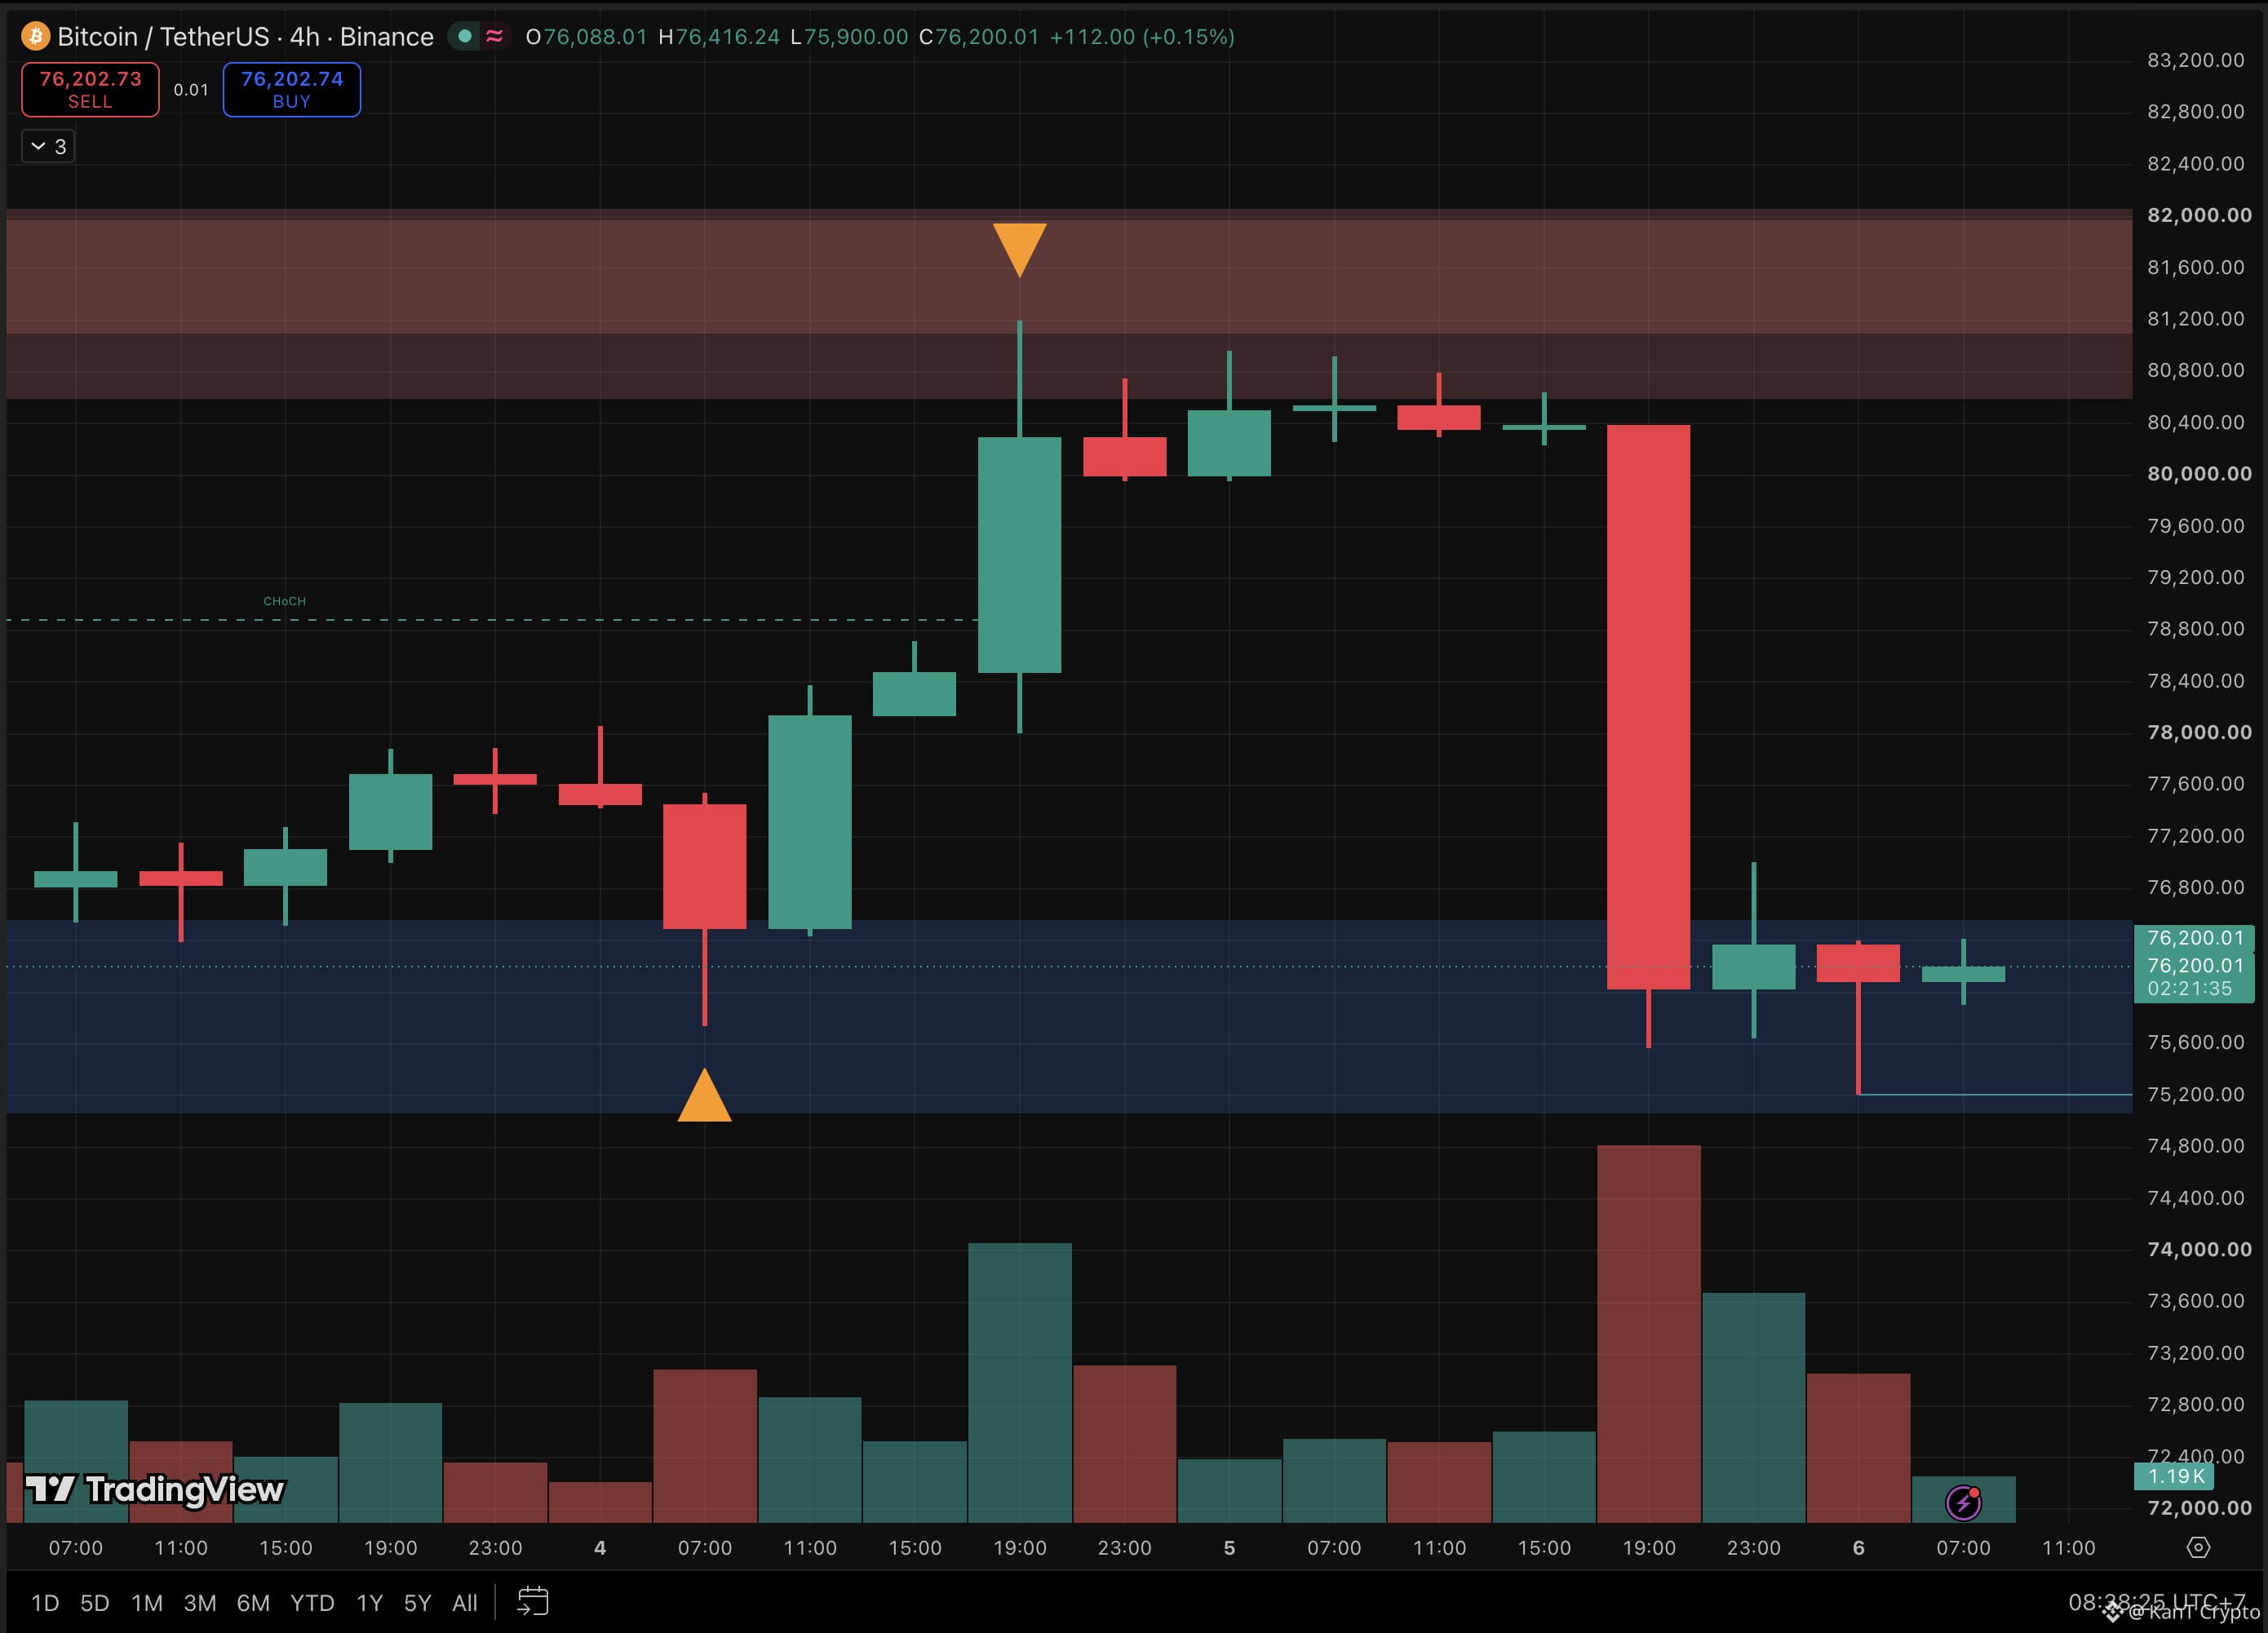
📉 $75.7K. $81.2K. $75.2K. Bitcoin’s 48-hour roller coaster just handed the bill to the bulls.
Wednesday the bears paid. Thursday it was the longs’ turn.
Dump candle: $80.4K to $76K, down 5.4% in 4H
Long liquidations: $954M in 24h, 88% of the total
Nasdaq 100: down 6.4%, worst session since March 2020
Gold, same session: up 0.6%
The midterm result that lifted stocks on Wednesday turned on them Thursday, as investors priced in a slower, pricier AI buildout. Bitcoin sank in the same hours on this chart’s heaviest volume, trading like a tech stock, not digital gold.
Yesterday’s map said lose $78.85K and the CHoCH (first sign of a trend flip) fails. It failed inside one candle, then blew through the $76.4K to $77.1K demand it pointed to. The ETF test flopped too: $74.6M in after $1.16B out.
The new low undercut election night, so the bounce structure is gone. But $75.2K landed inside the $75K to $76.5K demand zone, three candles wicked down and closed back near $76K or better, and open futures bets fell to their lowest since mid-September. Much of the leverage is already out.
What to watch:
4H close above $77K → that wick looks like a spring (a fake breakdown that traps sellers), $78.85K next as resistance.
4H close below $75K → demand breaks, the 200-day near $73.2K opens up.
Today’s US jobs report lands on a shaken market. Two liquidation waves in 48 hours, one each way. Leverage lost both times.
Spring off $75K, or a pause before the 200-day?
Not financial advice.
$BTC
$ETH
$NEAR
Wednesday the bears paid. Thursday it was the longs’ turn.
Dump candle: $80.4K to $76K, down 5.4% in 4H
Long liquidations: $954M in 24h, 88% of the total
Nasdaq 100: down 6.4%, worst session since March 2020
Gold, same session: up 0.6%
The midterm result that lifted stocks on Wednesday turned on them Thursday, as investors priced in a slower, pricier AI buildout. Bitcoin sank in the same hours on this chart’s heaviest volume, trading like a tech stock, not digital gold.
Yesterday’s map said lose $78.85K and the CHoCH (first sign of a trend flip) fails. It failed inside one candle, then blew through the $76.4K to $77.1K demand it pointed to. The ETF test flopped too: $74.6M in after $1.16B out.
The new low undercut election night, so the bounce structure is gone. But $75.2K landed inside the $75K to $76.5K demand zone, three candles wicked down and closed back near $76K or better, and open futures bets fell to their lowest since mid-September. Much of the leverage is already out.
What to watch:
4H close above $77K → that wick looks like a spring (a fake breakdown that traps sellers), $78.85K next as resistance.
4H close below $75K → demand breaks, the 200-day near $73.2K opens up.
Today’s US jobs report lands on a shaken market. Two liquidation waves in 48 hours, one each way. Leverage lost both times.
Spring off $75K, or a pause before the 200-day?
Not financial advice.
$BTC
$ETH
$NEAR