📊 BITCOIN DOMINANCE AT A CRITICAL ZONE — COULD ALTCOINS GET ROOM TO RUN?
Summary
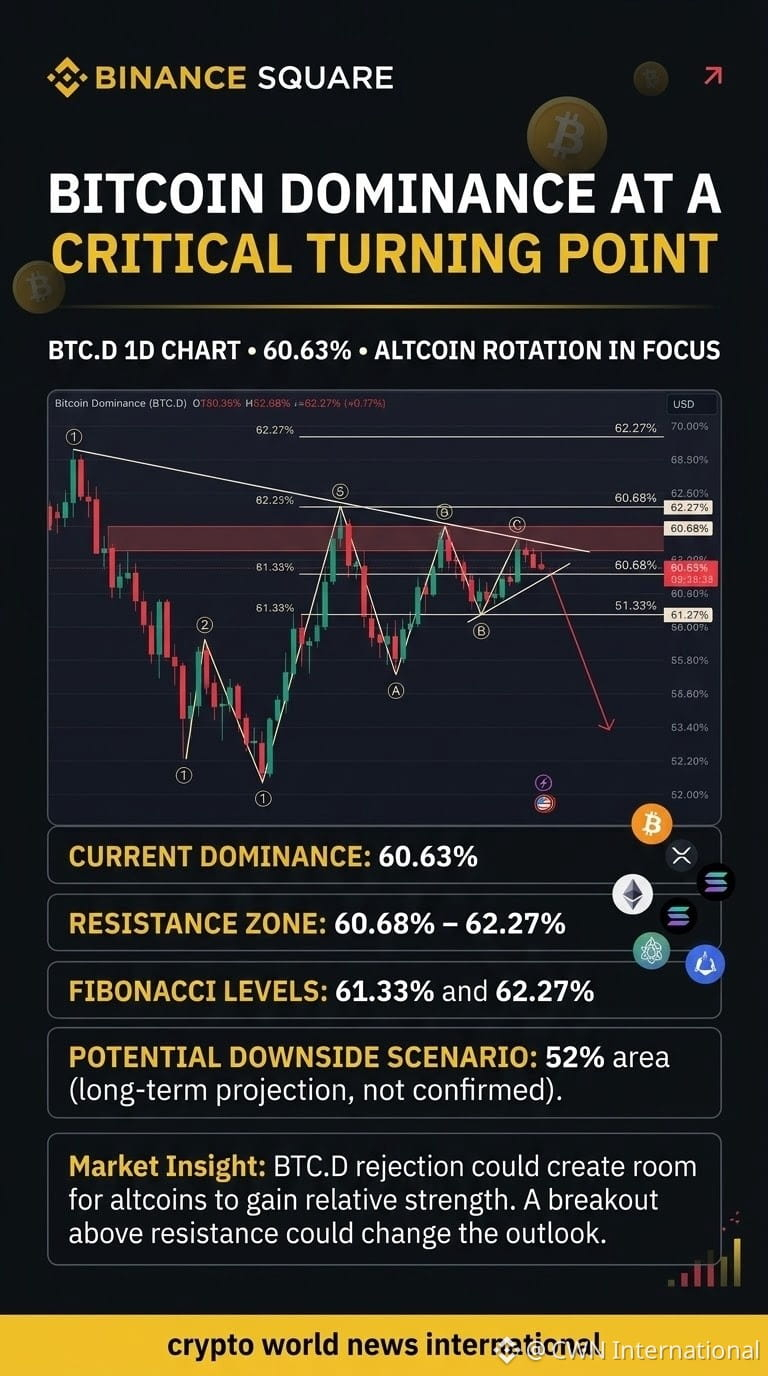
Bitcoin Dominance (BTC.D) is trading around 60.63%, approaching a key resistance area. The chart highlights a possible rejection from this zone, which could create an opportunity for altcoins to gain relative strength if dominance starts declining.
Key Levels to Watch
- Current BTC.D: Approximately 60.63%.
- Resistance zone: 60.68%–62.27%, with additional Fibonacci levels marked at 61.33% and 62.27%.
- Rising support: The yellow trendline below the recent price structure.
- Downside scenario: The chart illustrates a possible longer-term move toward the 52% area, but this is a projection—not a confirmed target.
Market Insight
A confirmed BTC.D breakdown could signal improving relative strength across altcoins. However, if dominance breaks above resistance, Bitcoin may continue to command a larger share of the crypto market.
Watch for a confirmed rejection or breakout before assuming an altcoin rotation.
Chart-based technical scenario. Not a guaranteed market forecast.
#bitcoindominance #altcoinseason #bitcoin #TechnicalAnalysis #BinanceSquare $BTC
Summary
Bitcoin Dominance (BTC.D) is trading around 60.63%, approaching a key resistance area. The chart highlights a possible rejection from this zone, which could create an opportunity for altcoins to gain relative strength if dominance starts declining.
Key Levels to Watch
- Current BTC.D: Approximately 60.63%.
- Resistance zone: 60.68%–62.27%, with additional Fibonacci levels marked at 61.33% and 62.27%.
- Rising support: The yellow trendline below the recent price structure.
- Downside scenario: The chart illustrates a possible longer-term move toward the 52% area, but this is a projection—not a confirmed target.
Market Insight
A confirmed BTC.D breakdown could signal improving relative strength across altcoins. However, if dominance breaks above resistance, Bitcoin may continue to command a larger share of the crypto market.
Watch for a confirmed rejection or breakout before assuming an altcoin rotation.
Chart-based technical scenario. Not a guaranteed market forecast.
#bitcoindominance #altcoinseason #bitcoin #TechnicalAnalysis #BinanceSquare $BTC