$MAGMA USDT — Explosive Breakout! Is Another Leg Up Coming? 🚀
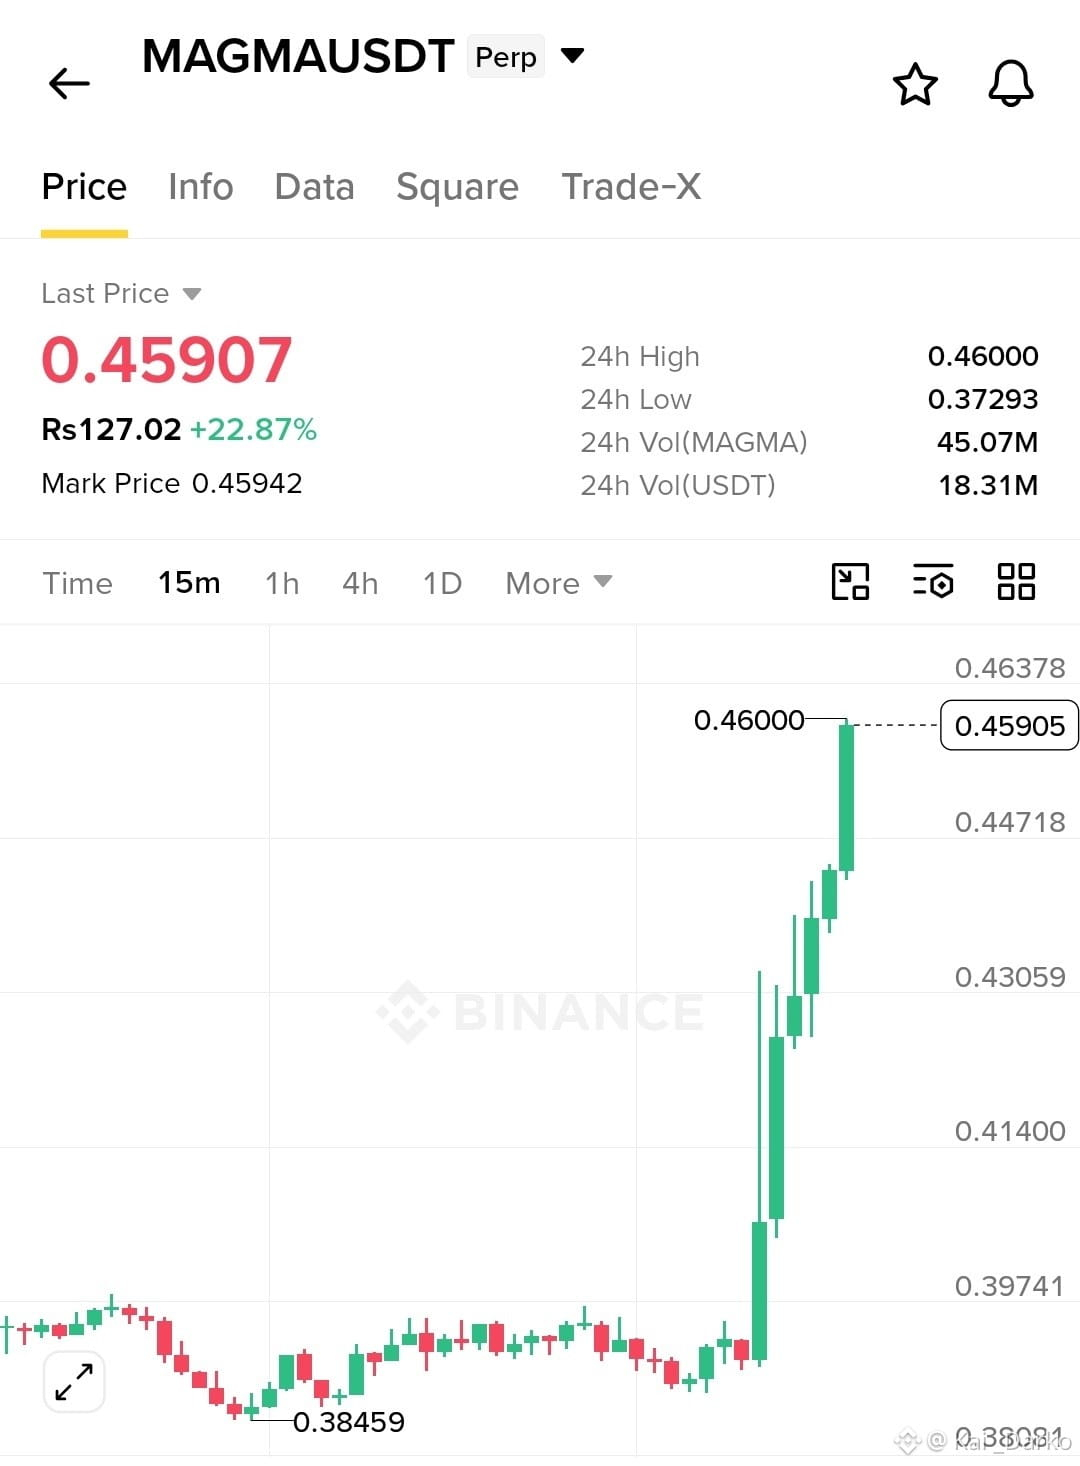
$MAGMA USDT is showing impressive bullish strength, climbing to $0.45907 (+22.87%) on the 15-minute chart. What caught my attention is the powerful breakout after an extended consolidation near $0.385–$0.397. Buyers have stepped in aggressively, pushing price toward the 24-hour high of $0.46000. However, chasing this rally at the top is not my preferred strategy.
📊 Market Structure & Key Levels
The previous swing low at $0.38459 marked the lower boundary of the visible range. The subsequent breakout created strong upward momentum and a clear bullish structure. Immediate resistance sits at $0.46000, while former breakout areas around $0.4470 and $0.4305 are potential support zones. Below them, $0.4140 is another important level.
🔍 Technical Perspective
Using the visible $0.38459–$0.46000 swing, approximate Fibonacci retracements place the 23.6% level near $0.4422 and the 38.2% level near $0.4312. These could provide useful pullback confluence. EMA, RSI and MACD readings are not displayed, so their confirmation cannot be verified.
🎯 Trading Plan
Entry Zone: $0.4400–$0.4470, preferably after bullish confirmation.
Stop Loss: $0.4290.
TP1: $0.4600
TP2: $0.4720
TP3: $0.4850
The extended targets are conditional projections, not confirmed resistance levels.
⚡ Next Move & Risk Management
A clean break above $0.4600 could open the door toward higher targets. Rejection may trigger a retest of $0.4470 or $0.4305. I would rather buy a confirmed retest than chase an extended candle. Keep position size controlled and protect capital.
Are you buying the breakout retest or waiting for a fresh move? 👀#BinanceReopensWithdrawalsForMoreAssets #BTCRebounds80K
$MAGMA USDT is showing impressive bullish strength, climbing to $0.45907 (+22.87%) on the 15-minute chart. What caught my attention is the powerful breakout after an extended consolidation near $0.385–$0.397. Buyers have stepped in aggressively, pushing price toward the 24-hour high of $0.46000. However, chasing this rally at the top is not my preferred strategy.
📊 Market Structure & Key Levels
The previous swing low at $0.38459 marked the lower boundary of the visible range. The subsequent breakout created strong upward momentum and a clear bullish structure. Immediate resistance sits at $0.46000, while former breakout areas around $0.4470 and $0.4305 are potential support zones. Below them, $0.4140 is another important level.
🔍 Technical Perspective
Using the visible $0.38459–$0.46000 swing, approximate Fibonacci retracements place the 23.6% level near $0.4422 and the 38.2% level near $0.4312. These could provide useful pullback confluence. EMA, RSI and MACD readings are not displayed, so their confirmation cannot be verified.
🎯 Trading Plan
Entry Zone: $0.4400–$0.4470, preferably after bullish confirmation.
Stop Loss: $0.4290.
TP1: $0.4600
TP2: $0.4720
TP3: $0.4850
The extended targets are conditional projections, not confirmed resistance levels.
⚡ Next Move & Risk Management
A clean break above $0.4600 could open the door toward higher targets. Rejection may trigger a retest of $0.4470 or $0.4305. I would rather buy a confirmed retest than chase an extended candle. Keep position size controlled and protect capital.
Are you buying the breakout retest or waiting for a fresh move? 👀#BinanceReopensWithdrawalsForMoreAssets #BTCRebounds80K