🚀 $APP USDT — Bulls Catch Their Breath After a Powerful 35% Rally!
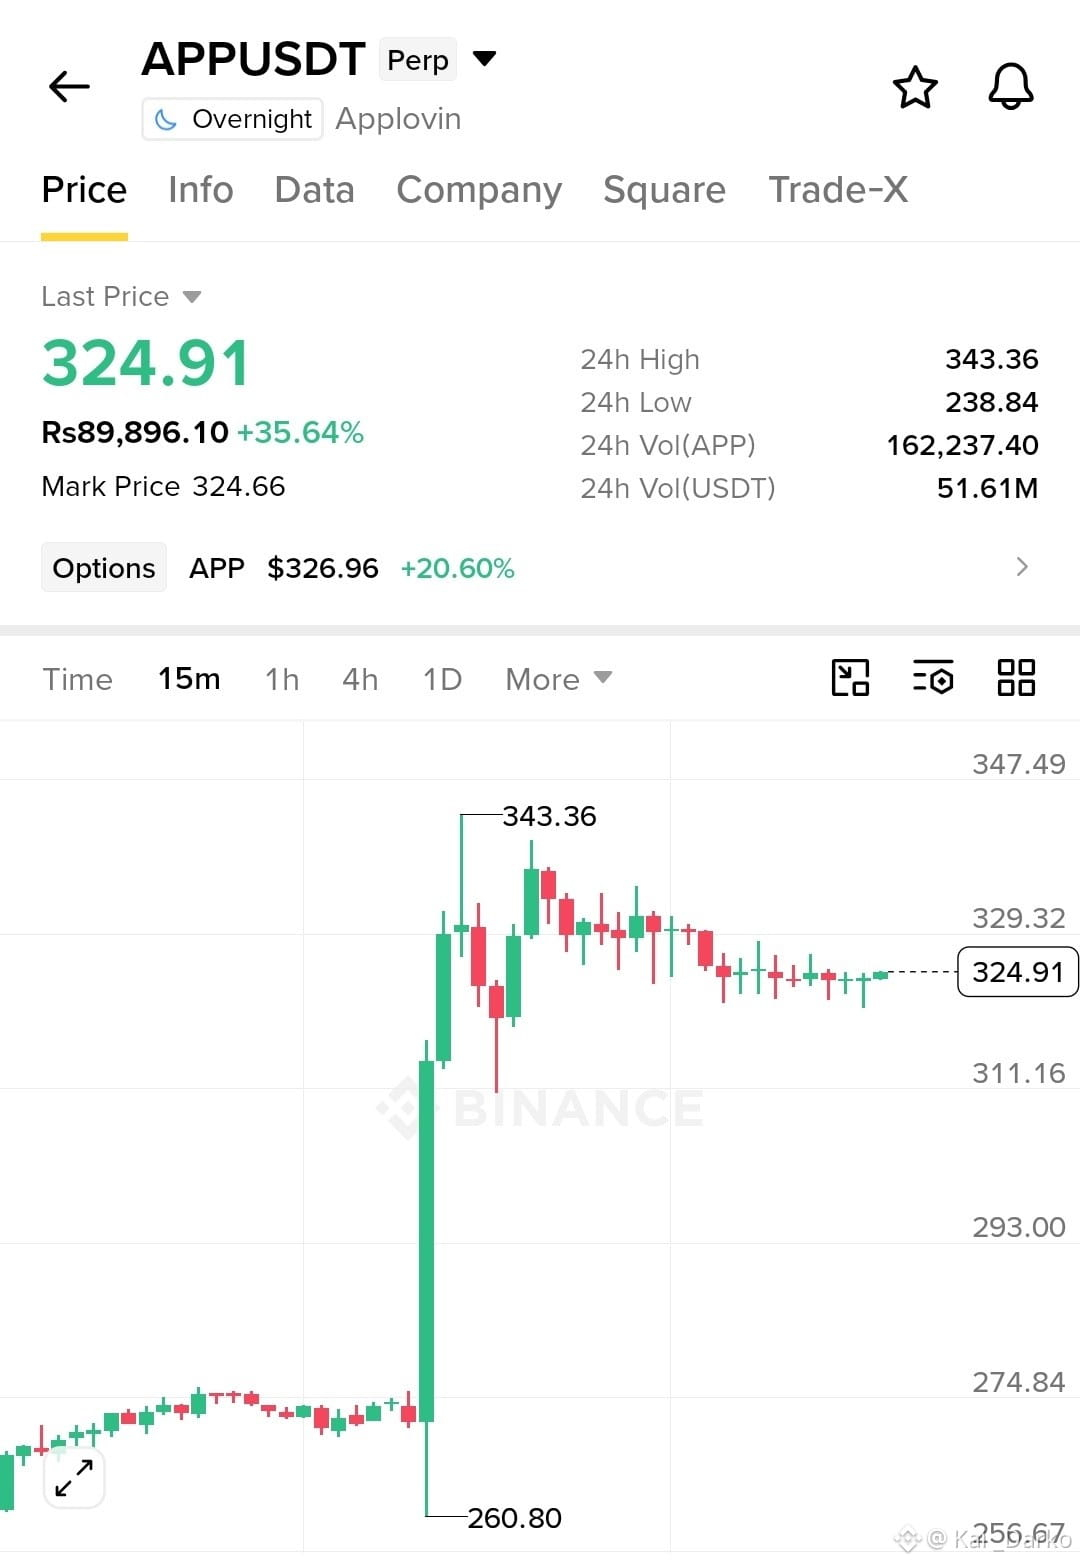
$APPUSDT is trading around 324.91, up 35.64%, after an aggressive breakout from the 260–275 area toward a 24H high of 343.36. Buyers clearly stepped in with strong momentum, but price is now consolidating below resistance. This is where the next direction becomes important.
📊 Market Structure & Key Levels
The 15-minute chart shows a strong bullish impulse followed by profit-taking and sideways movement. Price is holding near 324.91, while 329.32 is the first resistance. A sustained breakout could open the way toward 343.36.
Support sits around 320–322, with stronger structural support near 311.16. A breakdown below this area would weaken the bullish setup.
🎯 Trading Plan — Long Setup
* Entry Zone: $320–325 (only after bullish confirmation)
* Stop Loss: $309.80
* TP1: $329.32
* TP2: $343.36
* TP3: No reliable higher target visible; reassess after a confirmed breakout.
The visible swing from $260.80 to $343.36 places the approximate 38.2% Fibonacci retracement near $311.80, making the $311 area an important support zone.
⚡ Momentum & Risk
EMAs, RSI, MACD and volume indicators aren't visible, so their confirmation cannot be verified. Avoid chasing the rally; wait for a clean retest and manage position size carefully.
My focus is on whether buyers can defend $320 and reclaim $329. A rejection could bring another test of $311.
Are you buying this consolidation or waiting for a breakout above $329? 👀
#BinanceReopensWithdrawalsForMoreAssets #BTCRebounds80K #Binance98PercentReplenished
$APPUSDT is trading around 324.91, up 35.64%, after an aggressive breakout from the 260–275 area toward a 24H high of 343.36. Buyers clearly stepped in with strong momentum, but price is now consolidating below resistance. This is where the next direction becomes important.
📊 Market Structure & Key Levels
The 15-minute chart shows a strong bullish impulse followed by profit-taking and sideways movement. Price is holding near 324.91, while 329.32 is the first resistance. A sustained breakout could open the way toward 343.36.
Support sits around 320–322, with stronger structural support near 311.16. A breakdown below this area would weaken the bullish setup.
🎯 Trading Plan — Long Setup
* Entry Zone: $320–325 (only after bullish confirmation)
* Stop Loss: $309.80
* TP1: $329.32
* TP2: $343.36
* TP3: No reliable higher target visible; reassess after a confirmed breakout.
The visible swing from $260.80 to $343.36 places the approximate 38.2% Fibonacci retracement near $311.80, making the $311 area an important support zone.
⚡ Momentum & Risk
EMAs, RSI, MACD and volume indicators aren't visible, so their confirmation cannot be verified. Avoid chasing the rally; wait for a clean retest and manage position size carefully.
My focus is on whether buyers can defend $320 and reclaim $329. A rejection could bring another test of $311.
Are you buying this consolidation or waiting for a breakout above $329? 👀
#BinanceReopensWithdrawalsForMoreAssets #BTCRebounds80K #Binance98PercentReplenished