DAILY SIGNAL — SOL/USDT
Date: 05 Nov 2026
Timeframe: 1m
Intraday Bias: Post-BOS recovery → holding above key support → upside Fibonacci targets in focus
📊 MARKET BIAS
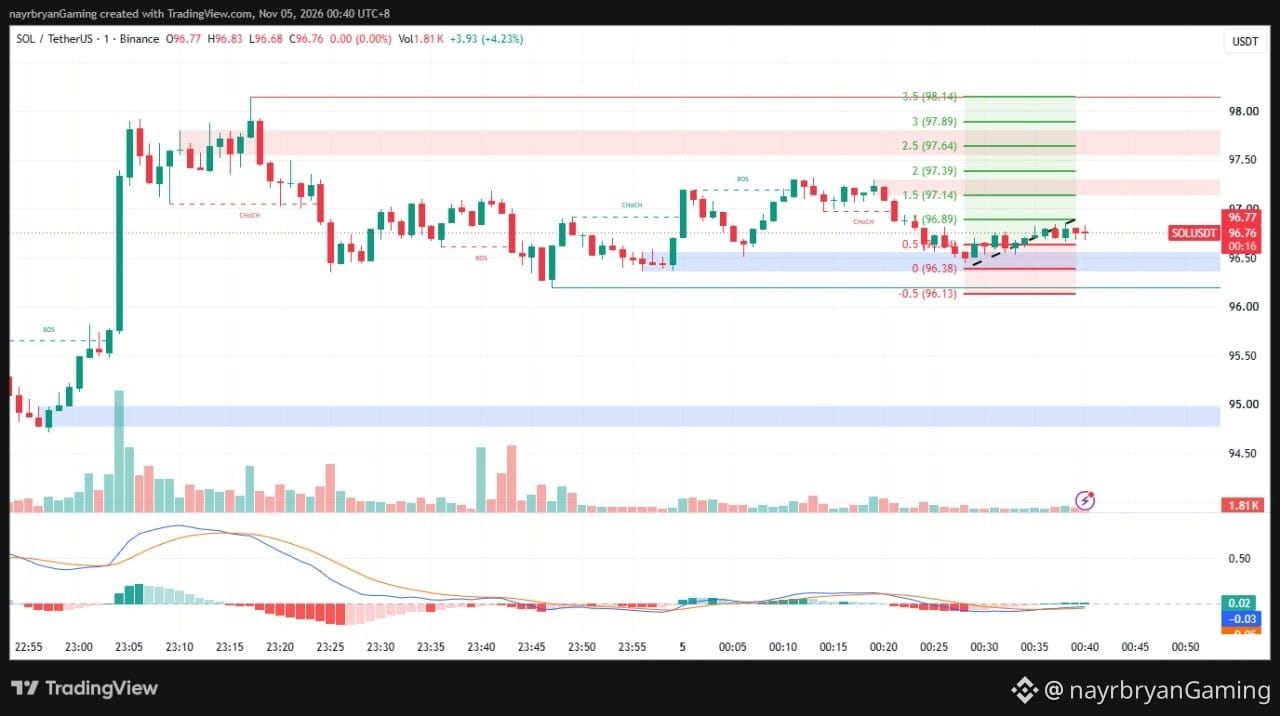
SOL is trading around 96.76 after a strong impulsive move and subsequent consolidation near the higher timeframe structure.
Price has printed multiple BOS (Break of Structure) to the upside and is currently holding above the blue support zone and the 0 Fibonacci level at 96.38. The latest price action shows a series of higher lows, with price attempting to build acceptance above the 0.5 Fib area near 96.89.
MACD is hovering near the zero line with a slight positive bias developing, while volume remains steady. As long as price maintains the current higher-low structure and stays above 96.38–96.50, the path of least resistance remains upward toward the Fibonacci extension targets.
A failure back below 96.38 would weaken the bullish recovery and reopen downside risk.
🔹 KEY LEVELS FROM CHART
Current Price: 96.76
Immediate Resistance: 96.89 – 97.14 (0.5 / 1.0 Fib)
Major Resistance: 97.39 – 97.64 (1.5 / 2.0 Fib) / pink zone higher
Key Support Zone: 96.38 – 96.50 (0 Fib + blue zone)
Fibonacci Invalidation Reference: 96.13 (-0.5 Fib)
🎯 FIBONACCI LEVELS
Potential Upside Levels:
TP1 → 96.89 (0.5 Fib)
TP2 → 97.14 (1.0 Fib)
TP3 → 97.39 (1.5 Fib)
TP4 → 97.64 (2.0 Fib)
TP5 → 97.89 (2.5 Fib)
TP6 → 98.14 (3.0 / 3.5 Fib area)
Downside Reference:
96.38 → 96.13
These are chart-derived reference levels, not guaranteed targets.
📈 TECHNICAL BREAKDOWN
1. Price Structure
Clear BOS sequence to the upside after the earlier CHoCH. Price is forming higher lows and consolidating above the blue support zone.
🧠 QUICK INSIGHT
“BOS gives the direction. Acceptance above support gives the confidence.”
⚠️ DISCLAIMER
This is personal chart analysis for educational purposes only, not financial advice.
Always DYOR / DYODD, manage risk responsibly, and wait for confirmation before making trading decisions.
— @nayrbryanGaming
#SOL #SOLUSDT #Binance #CryptoTrading #TechnicalAnalysis
Date: 05 Nov 2026
Timeframe: 1m
Intraday Bias: Post-BOS recovery → holding above key support → upside Fibonacci targets in focus
📊 MARKET BIAS
SOL is trading around 96.76 after a strong impulsive move and subsequent consolidation near the higher timeframe structure.
Price has printed multiple BOS (Break of Structure) to the upside and is currently holding above the blue support zone and the 0 Fibonacci level at 96.38. The latest price action shows a series of higher lows, with price attempting to build acceptance above the 0.5 Fib area near 96.89.
MACD is hovering near the zero line with a slight positive bias developing, while volume remains steady. As long as price maintains the current higher-low structure and stays above 96.38–96.50, the path of least resistance remains upward toward the Fibonacci extension targets.
A failure back below 96.38 would weaken the bullish recovery and reopen downside risk.
🔹 KEY LEVELS FROM CHART
Current Price: 96.76
Immediate Resistance: 96.89 – 97.14 (0.5 / 1.0 Fib)
Major Resistance: 97.39 – 97.64 (1.5 / 2.0 Fib) / pink zone higher
Key Support Zone: 96.38 – 96.50 (0 Fib + blue zone)
Fibonacci Invalidation Reference: 96.13 (-0.5 Fib)
🎯 FIBONACCI LEVELS
Potential Upside Levels:
TP1 → 96.89 (0.5 Fib)
TP2 → 97.14 (1.0 Fib)
TP3 → 97.39 (1.5 Fib)
TP4 → 97.64 (2.0 Fib)
TP5 → 97.89 (2.5 Fib)
TP6 → 98.14 (3.0 / 3.5 Fib area)
Downside Reference:
96.38 → 96.13
These are chart-derived reference levels, not guaranteed targets.
📈 TECHNICAL BREAKDOWN
1. Price Structure
Clear BOS sequence to the upside after the earlier CHoCH. Price is forming higher lows and consolidating above the blue support zone.
🧠 QUICK INSIGHT
“BOS gives the direction. Acceptance above support gives the confidence.”
⚠️ DISCLAIMER
This is personal chart analysis for educational purposes only, not financial advice.
Always DYOR / DYODD, manage risk responsibly, and wait for confirmation before making trading decisions.
— @nayrbryanGaming
#SOL #SOLUSDT #Binance #CryptoTrading #TechnicalAnalysis