NEAR Protocol (NEAR/USDT): Bullish Momentum Builds – Can Buyers Break the $4.27 Resistance?
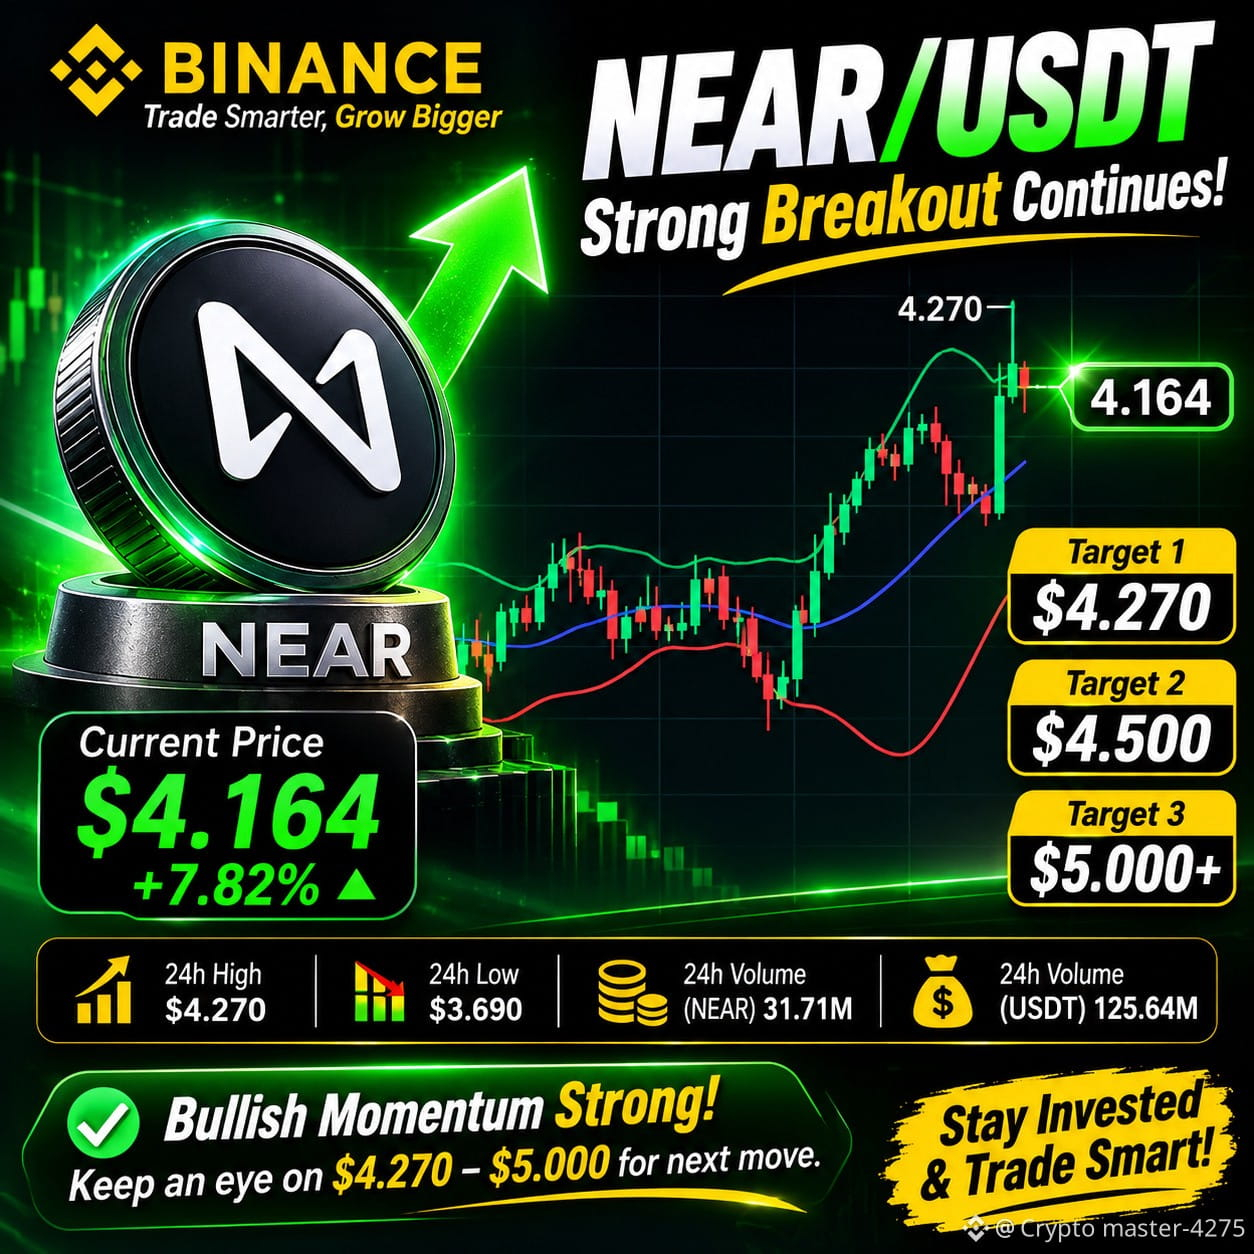
NEAR Protocol is showing encouraging bullish momentum, with the price trading around $4.164, up approximately 7.82% in the latest 24-hour snapshot.
The 30-minute chart highlights a strong recovery from the $3.690 low, followed by a powerful upward move. However, the market is now approaching an important resistance zone that could determine the next short-term direction.
Technical Analysis
1. Bollinger Bands Analysis
- Upper Band: $4.191
- Middle Band: $4.055
- Lower Band: $3.919
NEAR is trading close to the upper Bollinger Band, indicating strong buying momentum. However, this position can also increase the possibility of short-term consolidation or a pullback.
2. Key Resistance Levels
- $4.191: Immediate technical resistance.
- $4.270: Important 24-hour high and major breakout level.
- Above $4.270: A confirmed breakout could open the way toward higher price levels.
3. Important Support Levels
- $4.055: First support around the Bollinger middle band.
- $3.919: Secondary support.
- $3.690: Recent major swing low.
Holding above $4.055 would help maintain the current bullish structure.
Market Momentum
The recent upward movement reflects strong buying activity. However, the order book snapshot shows approximately 56.29% sell-side pressure versus 43.71% buy-side pressure.
This means buyers need to maintain momentum and overcome selling pressure near resistance.
What Could Happen Next?
Bullish Scenario: If NEAR breaks above $4.270 with strong volume and sustains that level, further upside could become possible.
Bearish Scenario: If the price fails to break resistance, a correction toward $4.055 or even $3.919 could occur.
Final Outlook
NEAR Protocol is showing positive short-term momentum, but the $4.270 resistance remains the key level to watch.
A confirmed breakout with strong volume could strengthen the bullish outlook. Until then, patience and proper risk management remain essential.
$BTC $ETH $NEAR
NEAR Protocol is showing encouraging bullish momentum, with the price trading around $4.164, up approximately 7.82% in the latest 24-hour snapshot.
The 30-minute chart highlights a strong recovery from the $3.690 low, followed by a powerful upward move. However, the market is now approaching an important resistance zone that could determine the next short-term direction.
Technical Analysis
1. Bollinger Bands Analysis
- Upper Band: $4.191
- Middle Band: $4.055
- Lower Band: $3.919
NEAR is trading close to the upper Bollinger Band, indicating strong buying momentum. However, this position can also increase the possibility of short-term consolidation or a pullback.
2. Key Resistance Levels
- $4.191: Immediate technical resistance.
- $4.270: Important 24-hour high and major breakout level.
- Above $4.270: A confirmed breakout could open the way toward higher price levels.
3. Important Support Levels
- $4.055: First support around the Bollinger middle band.
- $3.919: Secondary support.
- $3.690: Recent major swing low.
Holding above $4.055 would help maintain the current bullish structure.
Market Momentum
The recent upward movement reflects strong buying activity. However, the order book snapshot shows approximately 56.29% sell-side pressure versus 43.71% buy-side pressure.
This means buyers need to maintain momentum and overcome selling pressure near resistance.
What Could Happen Next?
Bullish Scenario: If NEAR breaks above $4.270 with strong volume and sustains that level, further upside could become possible.
Bearish Scenario: If the price fails to break resistance, a correction toward $4.055 or even $3.919 could occur.
Final Outlook
NEAR Protocol is showing positive short-term momentum, but the $4.270 resistance remains the key level to watch.
A confirmed breakout with strong volume could strengthen the bullish outlook. Until then, patience and proper risk management remain essential.
$BTC $ETH $NEAR