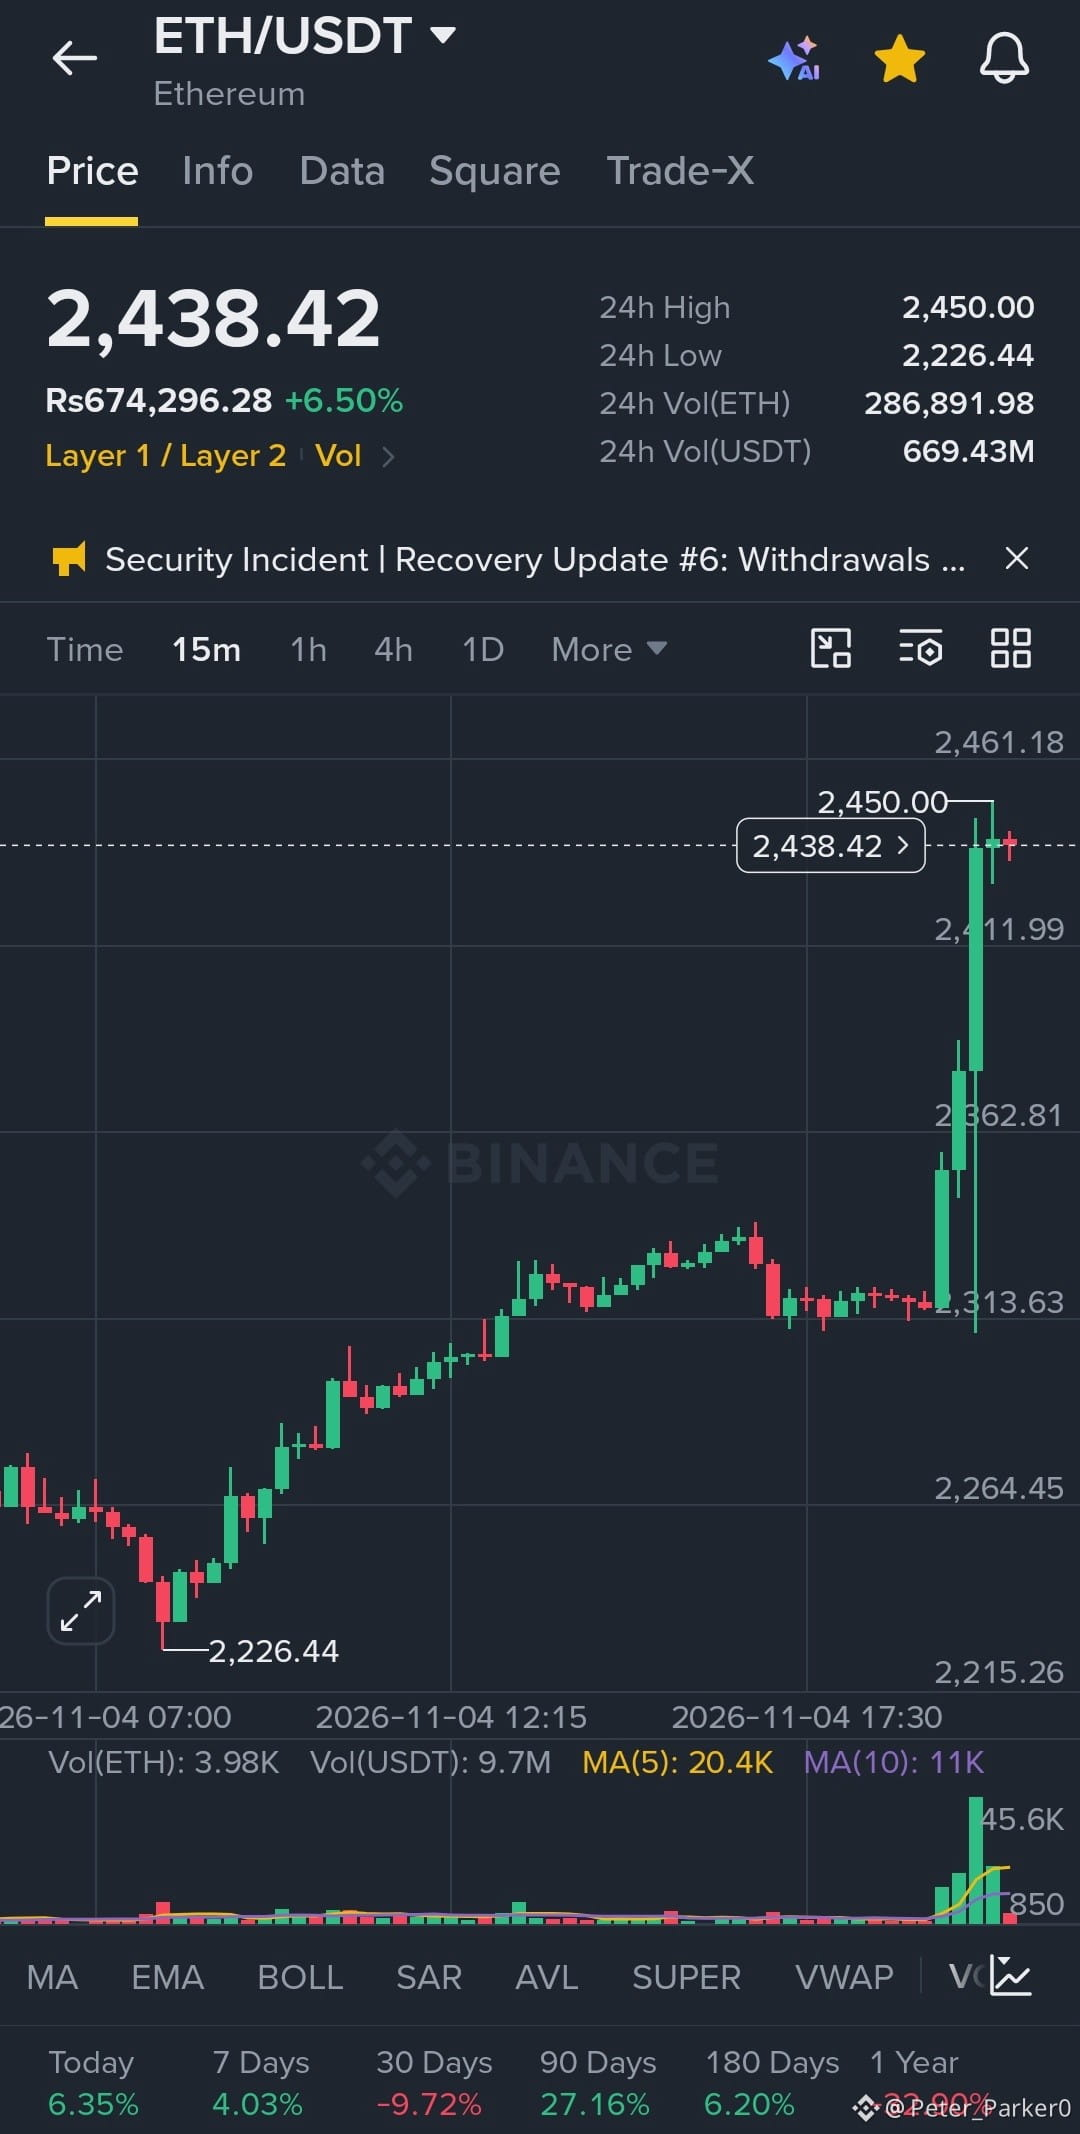

What caught my eye on the ETH/USDT 1h chart is how little the market gave anyone a chance to enter. A handful of big green candles took price from the 2,226.52 low to 2,439.75, roughly 6.6% on the day.
For most of 11/02 to 11/04, ETH was making a series of lower swings and chopping sideways. The 24h low at 2,226.52 looks like the turning point, with higher lows building after it. The move is now stalling just under the 24h high of 2,450.74. That is a recovery, but it is still a very fresh one.
On the volume panel, the last candle prints 25.18K against a MA5 of 9.66K and a MA10 of 7.08K. That is a clear expansion from quiet conditions, which supports the move. A single volume spike can also mark exhaustion, so I treat it as interest, not confirmation. Resistance sits at 2,450.74, and the nearest visible support levels are 2,394.68 and 2,338.63.
Chasing a near-vertical run is where most people get hurt. Entering at the top of a stretched candle means a wide stop or a tiny margin for error.
My plan is to wait for a pullback toward 2,394.68, with a stop below 2,338.63. Risk is about 56 points. The only target the chart clearly marks is the 2,450.74 high, which is about 56 points of reward, or 1:1. That is not attractive, so I won't force it. Above 2,450.74 there is no mapped resistance, so I won't invent targets there.
Confirmation would be a pullback that holds 2,394.68 with shrinking volume, followed by a strong close above 2,450.74. A close back below 2,338.63 would invalidate the idea.
This is analysis, not a guarantee. Protect your capital first and size positions so a stop-out doesn't hurt.
Do you see this as the start of a trend change, or just a sharp bounce that needs a retest of the 2,282 area?
$CLANKER
$AGT
$ETH
For most of 11/02 to 11/04, ETH was making a series of lower swings and chopping sideways. The 24h low at 2,226.52 looks like the turning point, with higher lows building after it. The move is now stalling just under the 24h high of 2,450.74. That is a recovery, but it is still a very fresh one.
On the volume panel, the last candle prints 25.18K against a MA5 of 9.66K and a MA10 of 7.08K. That is a clear expansion from quiet conditions, which supports the move. A single volume spike can also mark exhaustion, so I treat it as interest, not confirmation. Resistance sits at 2,450.74, and the nearest visible support levels are 2,394.68 and 2,338.63.
Chasing a near-vertical run is where most people get hurt. Entering at the top of a stretched candle means a wide stop or a tiny margin for error.
My plan is to wait for a pullback toward 2,394.68, with a stop below 2,338.63. Risk is about 56 points. The only target the chart clearly marks is the 2,450.74 high, which is about 56 points of reward, or 1:1. That is not attractive, so I won't force it. Above 2,450.74 there is no mapped resistance, so I won't invent targets there.
Confirmation would be a pullback that holds 2,394.68 with shrinking volume, followed by a strong close above 2,450.74. A close back below 2,338.63 would invalidate the idea.
This is analysis, not a guarantee. Protect your capital first and size positions so a stop-out doesn't hurt.
Do you see this as the start of a trend change, or just a sharp bounce that needs a retest of the 2,282 area?
$CLANKER
$AGT
$ETH