🚀 $BTC USDT — Bulls Take Control After a Powerful Breakout!
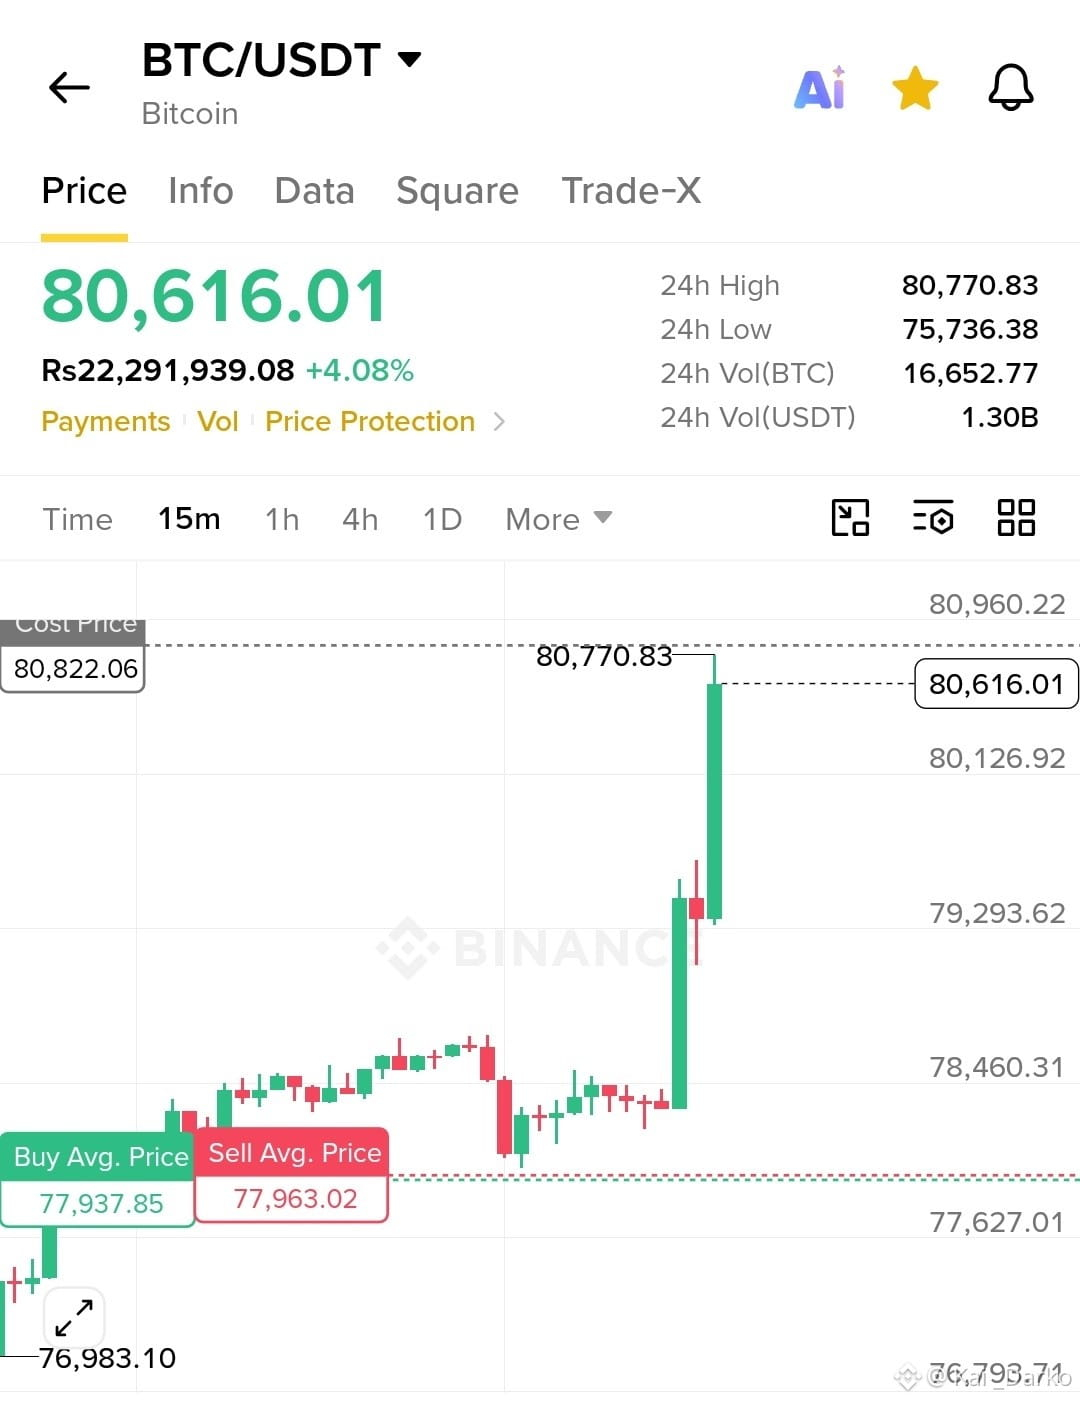
Bitcoin is showing serious buying strength on the 15-minute chart. After dropping to $75,725.3, BTC recovered aggressively, built a series of higher lows, and finally pushed above the previous consolidation around $78,200–$78,500. Price is now trading near $80,584, just below the 24H high of $80,699.3.
Market Structure & Key Levels
The recovery structure remains bullish, with buyers stepping in after the earlier sell-off. The breakout suggests strong demand, but BTC is approaching resistance where profit-taking could appear.
Immediate resistance sits at $80,699. Support to watch is $79,455, followed by the important $78,212 zone. The swing midpoint around $78,212 also provides a useful 50% retracement reference.
Technical Perspective
The sharp bullish candles show strong short-term momentum. However, EMA 20/50/100/200, RSI, MACD and volume bars are not displayed, so their confirmation cannot be verified.
🎯 Trading Plan — Bullish Setup
Entry Zone: $79,500–$79,900 after a confirmed retest.
Stop Loss: $78,950.
TP1: $80,699
TP2: $82,050
TP3: $83,770
TP2 and TP3 are measured-move extension projections, not confirmed resistance levels.
What Comes Next?
A clean 15-minute close above $80,699 could open the door toward higher extension targets. Rejection followed by a break below $79,455 would weaken the setup.
I would rather buy a confirmed retest than chase this sudden pump. Keep position size controlled and protect capital. 📈
Are you expecting BTC to break $81K next, or will sellers step in first?
Bitcoin is showing serious buying strength on the 15-minute chart. After dropping to $75,725.3, BTC recovered aggressively, built a series of higher lows, and finally pushed above the previous consolidation around $78,200–$78,500. Price is now trading near $80,584, just below the 24H high of $80,699.3.
Market Structure & Key Levels
The recovery structure remains bullish, with buyers stepping in after the earlier sell-off. The breakout suggests strong demand, but BTC is approaching resistance where profit-taking could appear.
Immediate resistance sits at $80,699. Support to watch is $79,455, followed by the important $78,212 zone. The swing midpoint around $78,212 also provides a useful 50% retracement reference.
Technical Perspective
The sharp bullish candles show strong short-term momentum. However, EMA 20/50/100/200, RSI, MACD and volume bars are not displayed, so their confirmation cannot be verified.
🎯 Trading Plan — Bullish Setup
Entry Zone: $79,500–$79,900 after a confirmed retest.
Stop Loss: $78,950.
TP1: $80,699
TP2: $82,050
TP3: $83,770
TP2 and TP3 are measured-move extension projections, not confirmed resistance levels.
What Comes Next?
A clean 15-minute close above $80,699 could open the door toward higher extension targets. Rejection followed by a break below $79,455 would weaken the setup.
I would rather buy a confirmed retest than chase this sudden pump. Keep position size controlled and protect capital. 📈
Are you expecting BTC to break $81K next, or will sellers step in first?