$BMT IS UP 18.30% BUT CAN BUYERS HOLD THE BREAKOUT?
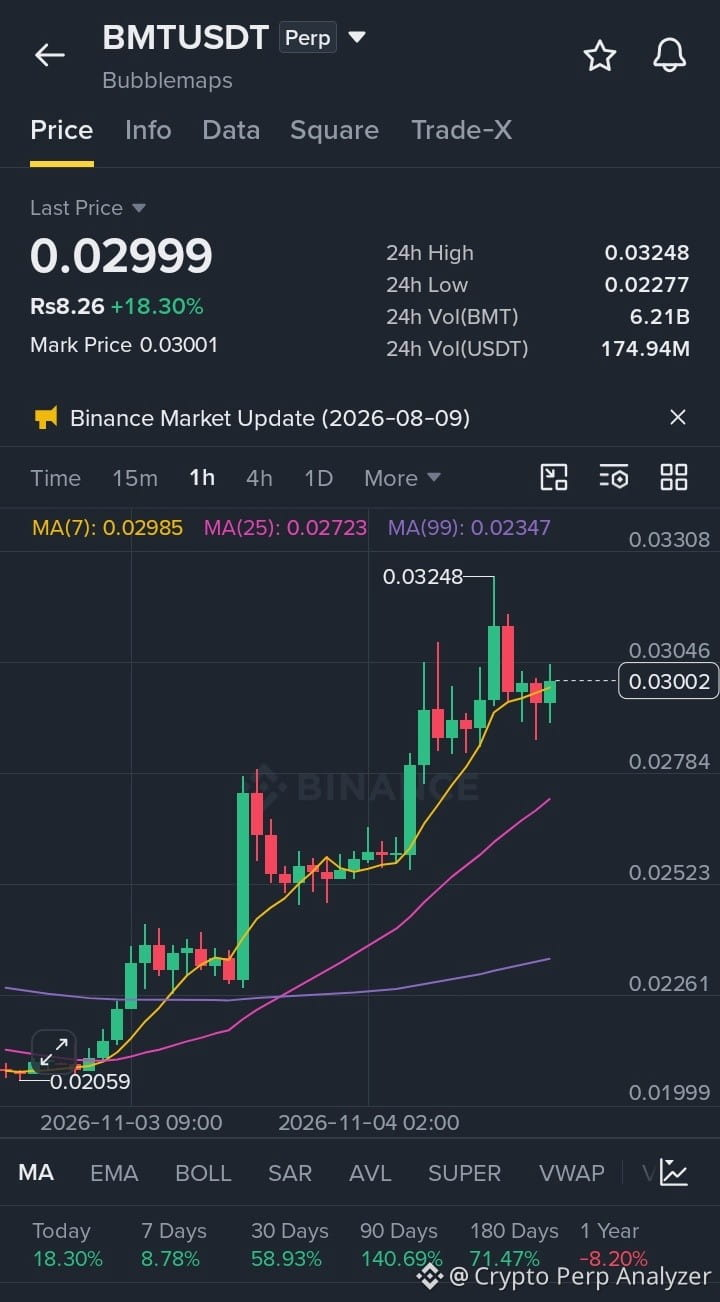
Bubblemaps (BMT) is trading near $0.02999, up 18.30% over 24 hours. The move is impressive, but I would not chase a green candle without checking whether buyers can defend the levels they have just reclaimed.
The strongest clue in the supplied data is participation: 24-hour volume is about 6.21 billion BMT, worth roughly $174.94 million in USDT. That points to heavy trading activity, although volume alone cannot tell us whether the buying is driven by fresh demand, short covering, or rapid speculation. No specific news catalyst is confirmed by these figures, so I would avoid inventing one.
Technically, price is above the MA(7) at $0.02985, MA(25) at $0.02723 and MA(99) at $0.02347. That alignment supports a bullish short-term structure. However, the market is approaching resistance around $0.03046, with the 24-hour high at $0.03248. A rejection here could trigger profit-taking after the sharp advance. If buyers clear $0.03046 and hold it on a retest, momentum may extend toward the recent high and then $0.03308, shown on the chart.
My approach would be patient: watch whether $0.0295–$0.0300 holds as support rather than entering impulsively. A sustained move below that zone would weaken the immediate setup and put the $0.0278–$0.0272 area back in focus. The wider trend remains constructive while price stays above the 25-period average, but a fast rally can reverse just as quickly. That distinction matters more than the percentage gain on the screen.
Potential trade plan (long, confirmation required):
Entry: $0.0295–$0.0300 after a successful retest
TP1: $0.03046
TP2: $0.03248
TP3: $0.03308
SL: $0.02870
These are conditional chart levels, not a guaranteed signal. Keep position size modest and skip the trade if support fails or the entry offers poor risk-to-reward.
Would you wait for a clean breakout, or let BMT retest support first?
#BMT
Bubblemaps (BMT) is trading near $0.02999, up 18.30% over 24 hours. The move is impressive, but I would not chase a green candle without checking whether buyers can defend the levels they have just reclaimed.
The strongest clue in the supplied data is participation: 24-hour volume is about 6.21 billion BMT, worth roughly $174.94 million in USDT. That points to heavy trading activity, although volume alone cannot tell us whether the buying is driven by fresh demand, short covering, or rapid speculation. No specific news catalyst is confirmed by these figures, so I would avoid inventing one.
Technically, price is above the MA(7) at $0.02985, MA(25) at $0.02723 and MA(99) at $0.02347. That alignment supports a bullish short-term structure. However, the market is approaching resistance around $0.03046, with the 24-hour high at $0.03248. A rejection here could trigger profit-taking after the sharp advance. If buyers clear $0.03046 and hold it on a retest, momentum may extend toward the recent high and then $0.03308, shown on the chart.
My approach would be patient: watch whether $0.0295–$0.0300 holds as support rather than entering impulsively. A sustained move below that zone would weaken the immediate setup and put the $0.0278–$0.0272 area back in focus. The wider trend remains constructive while price stays above the 25-period average, but a fast rally can reverse just as quickly. That distinction matters more than the percentage gain on the screen.
Potential trade plan (long, confirmation required):
Entry: $0.0295–$0.0300 after a successful retest
TP1: $0.03046
TP2: $0.03248
TP3: $0.03308
SL: $0.02870
These are conditional chart levels, not a guaranteed signal. Keep position size modest and skip the trade if support fails or the entry offers poor risk-to-reward.
Would you wait for a clean breakout, or let BMT retest support first?
#BMT