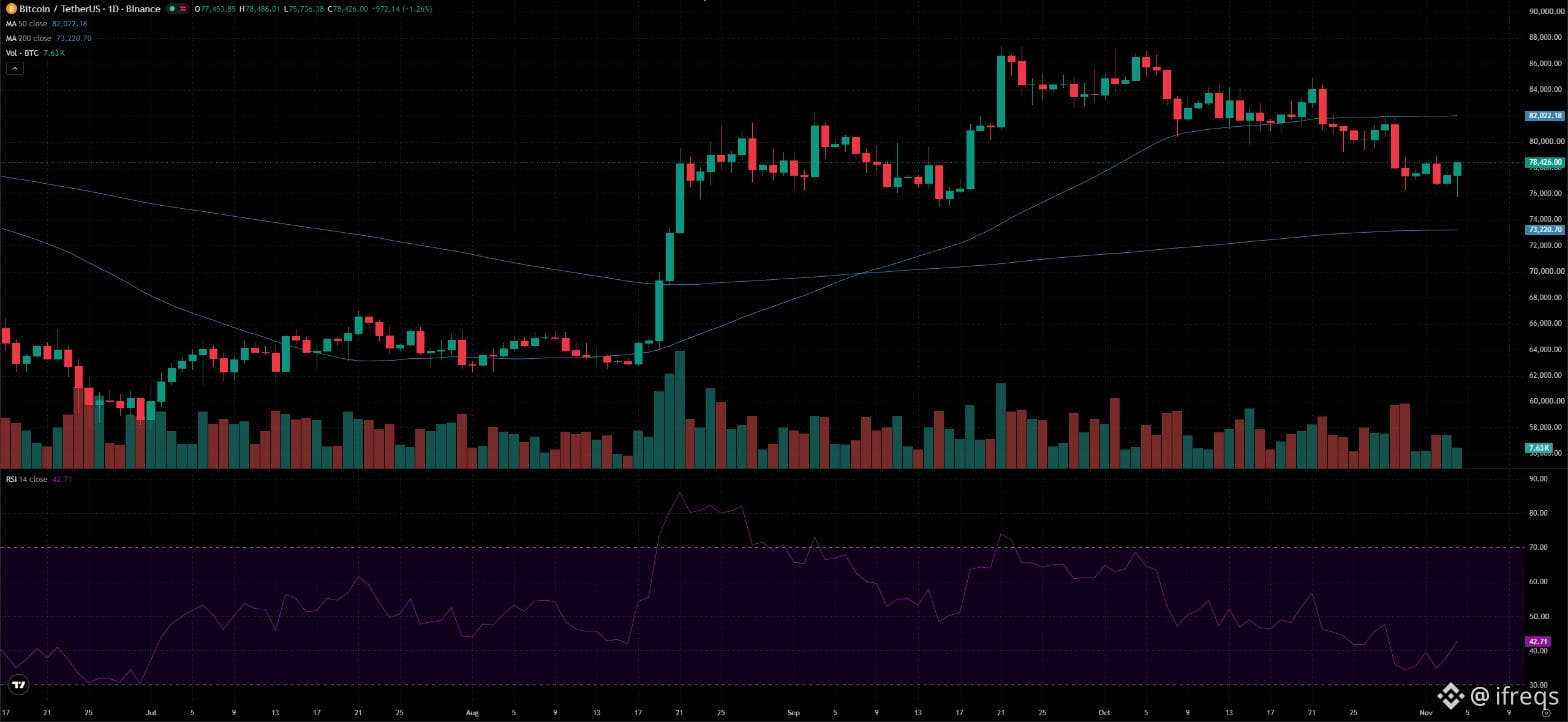

$BTC swept $75.7K overnight and was back above $78K within three hours.
That's the third time in six days the $75.7K–$76.4K zone has held: $76,326 on Oct 30, $76,389 yesterday, $75,736 today. Since September, only Sep 15–16 traded lower ($74,968).
Yet the trend picture hasn't improved.
Price is still below the 20-day ($80.2K) and 50-day ($82.0K) averages, and daily RSI sits at 43.
~Above the 200-day ($73.2K) since Aug 19
~Binance futures OI +5% since Oct 26 (98.7K BTC) while price fell
~US spot ETFs -$1.16B over the last three sessions, per Farside Investors
~Fear & Greed at 34
That's a pretty interesting mix: buyers keep defending the same floor, but leverage keeps building into it.
My read is $79K–$80K is the level that matters. A daily close back above it makes Oct 29 look like a fake breakdown. Lose $75K and the 200-day is next.
But one wick isn't a reversal, and rising OI can flush either way.
Which breaks first, $80K or $75K?
That's the third time in six days the $75.7K–$76.4K zone has held: $76,326 on Oct 30, $76,389 yesterday, $75,736 today. Since September, only Sep 15–16 traded lower ($74,968).
Yet the trend picture hasn't improved.
Price is still below the 20-day ($80.2K) and 50-day ($82.0K) averages, and daily RSI sits at 43.
~Above the 200-day ($73.2K) since Aug 19
~Binance futures OI +5% since Oct 26 (98.7K BTC) while price fell
~US spot ETFs -$1.16B over the last three sessions, per Farside Investors
~Fear & Greed at 34
That's a pretty interesting mix: buyers keep defending the same floor, but leverage keeps building into it.
My read is $79K–$80K is the level that matters. A daily close back above it makes Oct 29 look like a fake breakdown. Lose $75K and the 200-day is next.
But one wick isn't a reversal, and rising OI can flush either way.
Which breaks first, $80K or $75K?